Origin
In the 20th century, multi-business enterprises were emerging and companies struggled to manage different business units profitably. One such that arose was for GE in the 1970s, to effectively analyze and manage a business portfolio, GE hired McKinsey & Company to develop a strategic framework [1] to address this complexity. GE-McKinsey nine-box framework is based on the footsteps of BCG’s growth share matrix.
The Framework
According to StrategicManagementInsight.com [2] :
In the business world, much like anywhere else, the problem of resource scarcity is affecting the decisions the companies make. With limited resources, but many opportunities of using them, the businesses need to choose how to use their cash best. The fight for investments takes place in every level of the company: between teams, functional departments, divisions or business units. The question of where and how much to invest is an ever going headache for those who allocate the resources.
Multi business companies manage complex business portfolios, often, with as much as 50, 60 or 100 products and services. The products or business units differ in what they do, how well they perform or in their future prospects. This makes it very hard to make a decision in which products the company should invest. At least, it was hard until the BCG matrix and its improved version GE-McKinsey matrix came to help. These tools solved the problem by comparing the business units and assigning them to the groups that are worth investing in or the groups that should be harvested or divested.
Previously, companies primarily used projections of future cash flow, market growth rate, market share, etc. as the key elements to make investments. GE had a portfolio of over 150 business units. To analyze and manage a variety of businesses, McKinsey developed a sophisticated strategy tool, for multi-business corporation, which uses a systematic approach to make business decisions regarding investments in the sub-units of the corporation. The framework is based on two factors: the attractiveness of the relevant industry and the unit’s competitive strength within that industry
The GE-McKinsey Matrix is an excellent tool. It allows organizations to conduct effective portfolio planning based on the strength and industry attractiveness of each business unit. This nine-box matrix was created by McKinsey in the 1970s to help General Electric (GE) determine how to best invest in their business units. The GE-McKinsey Matrix helped GE prioritize not only where to focus their money, but also time, talent, and energy. Let’s jump right in and see how it could benefit a business.

GE-McKinsey Nine Box Matrix
Industry Attractiveness
Industry attractiveness indicates how hard or easy it will be for a company to compete in the market and earn profits. The more profitable the industry is the more attractive it becomes. When evaluating the industry attractiveness, analysts should look how an industry will change in the long run rather than in the near future, because the investments needed for the product usually require long lasting commitment.
Various factors collectively determine the attractiveness of a particular industry. These can be growth potential in the long term, industry size, the structure of the industry, the profitability of the industry, product life cycle, power of buyers and suppliers. Furthermore, macroeconomic factors like government policies and inflation rates can also influence industry attractiveness. There’s no definite list of which factors should be included to determine industry attractiveness, but the following are the most common:
- Long run growth rate
- Industry size
- Industry profitability: entry barriers, exit barriers, supplier power, buyer power, threat of substitutes and available complements (use Porter’s Five Forces analysis to determine this)
- Industry structure (use Structure-Conduct-Performance framework to determine this)
- Product life cycle changes
- Changes in demand
- Trend of prices
- Macro environment factors (use PEST or PESTEL for this)
- Seasonality
- Availability of labor
- Market segmentation
To determine each business unit’s industry attractiveness, these steps can be followed (in the same order):
- List down relevant industry factors
- Allocate weights to the factors (aggregate weight should be 1.0)
- Give rating to the factors (On a scale of 1 to 5)
- Determine the final score of business units
Business Unit Strength
The second dimension in the matrix measures the business unit’s strength against its competitors. The competitive strength can be decided based on the following factors:
- Total market share of the business unit
- Market share growth potential
- Brand Awareness
- Brand loyalty among customers
- Company’s profitability
- Product differentiation from competitors
- Customer loyalty
- VRIO resources or capabilities
- Business unit strength in meeting industry’s critical success factors
- Strength of the value chain
- Production flexibility
If the business unit score well in these factors, then it can be determined that the business has a competitive edge. The sustainability of competitive advantage needs to be determined in the long term.
The process to evaluate business unit’s competitive strength is similar to industry attractiveness (in the same order):
- Factors list of competitive strength
- Weight allocation to the factors (aggregate weight should be 1.0)
- Factor rating (On a scale of 1 to 5)
- Total score of business units
Strategic Implications
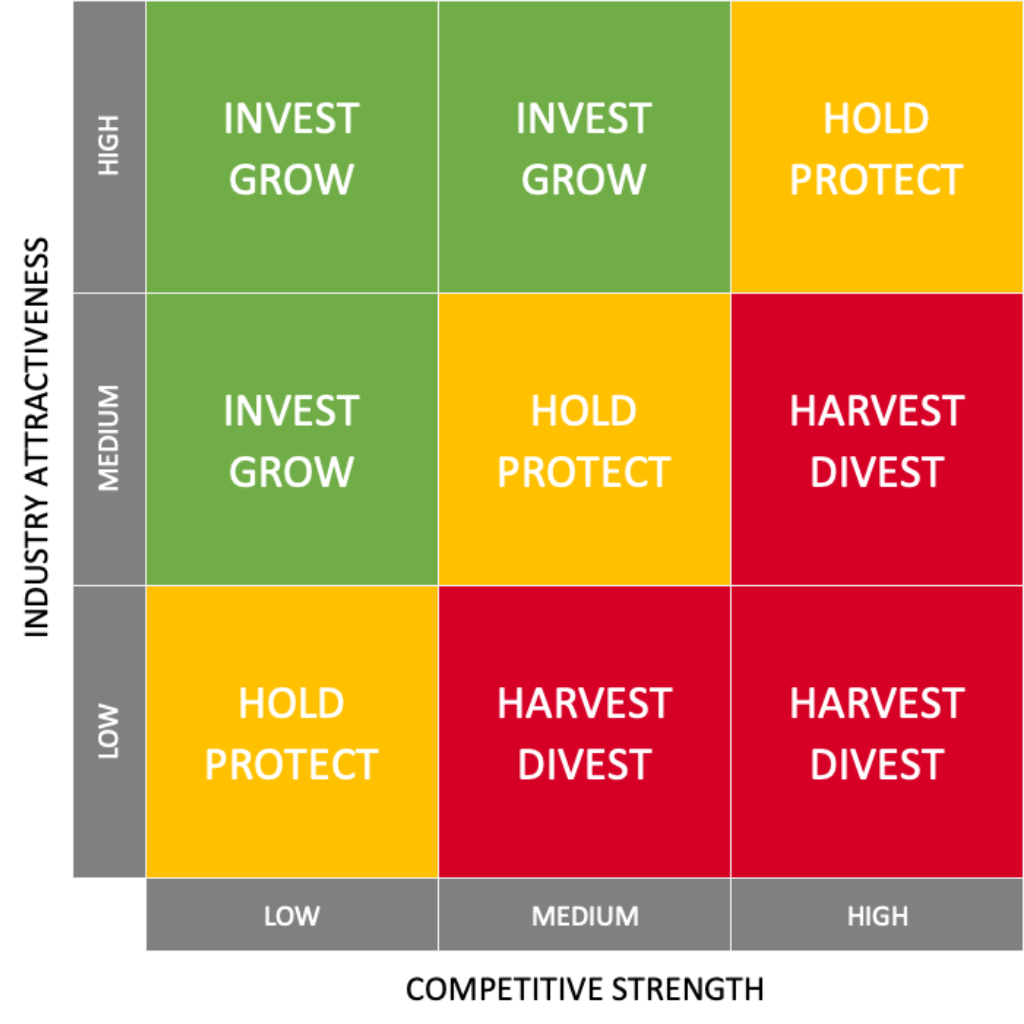
The three degrees (High, Medium, and Low) of Industry Attractiveness and Competitive Strength provide 9 different strategic postures for a business. The strategic actions to choose from are:
- Grow / Invest
- Hold / Protect
- Harvest / Divest
Grow / Invest
This is the best-case scenario for a business unit. Industry attractiveness and Competitive strength are moderate to high, indicating a well-positioned entity. There is a scope of growth potential for the business unit either to capture more market share or increase profitability by reaching economies of scale or increasing marketing efforts.
A company can reach this scenario if it is operating in a moderate to highly attractive industry while having a moderate to highly competitive position within that industry. In such a situation there is a massive potential for growth. However, to grow, a company needs resources such as assets, capital, technology, and manpower. These investments are necessary to increase capacity, to reach new customers through more advertisements or to improve products through Research & Development.
A business entity can grow either through organic growth where the resources are invested in Research and Development, marketing products, and increasing brand awareness. The most notable challenge for companies in these sections are resource constraints that block them from growing bigger and becoming/maintaining market leadership. The same can also be accomplished externally via Mergers and Acquisitions (M&A) as a strategy of inorganic growth. Again, it will require investments to execute M&A activities.
Hold / Protect
This strategy is also known by Selectivity / Earnings strategy. The business unit falling under this category has an ambiguous position. The business is either in a low to moderate competitive position in an attractive industry or an extremely highly competitive position in a less attractive industry. The future growth potential may remain underwhelming.
Deciding on whether to invest or not to invest largely depends on the outlook that is expected of either the improvement in competitive position or the potential to shift to more interesting industries. In other words, this requires managerial judgment whether they want to grow the business units or not. The Grow category business unit take precedence in case if the managers decide on investing in the units in the Hold category.
Nevertheless, these decisions have to be made very carefully, since you want to use most of the investments available to the companies in the Invest/Grow section. The left-over investments should be used for the companies in the Selectivity/Earnings section with the highest potential for improvements, while being monitored closely to measure its progress on the way.
Harvest / Divest
This strategy is appropriate for business units when they have a low competitive advantage, are active in an unattractive industry or a combination of both. There is low or no scope of industry growth. These companies have no promising outlooks anymore and should not be invested in. These business units are not accruing a return on capital in comparison to other units. Managers have two options here:
- Divest the business units by selling it to an interested buyer for a reasonable price. This also known as carve-out. Selling the business unit to another player in the industry that has a better competitive position is not a strange idea at all. The buyer might have better competences to make it a success or they can create value by combining activities (synergies). The cash that results from selling the business unit can consequently be used in Invest/Grow business units elsewhere in the portfolio
- Choose a harvest strategy. This basically means that the business unit gets just enough investments or non at all to just sustain the business, while reaping (skimming) the remaining rewards that may be left. This is a very short-term perspective action that allows managers to extract as much value as possible. However, this strategy eventually results in liquidation of the business unit
Advantages
The GE-McKinsey Nine box matrix is an extension of BCG matrix formulated in the late 1970s. There are certain advantages that makes this framework more attractive to companies for resource allocation:
- Unlike BCG matrix, resources are plotted between Industry attractiveness and business unit strength that takes a holistic consideration of various factors such as market demand & size, industry rivalry, micro & macro environmental factors, global opportunities, distribution channels, profitability and so on which provides an exhaustive comparison between different business units and give a clear picture to the management for efficient resource allocation
- GE-McKinsey Nine box matrix can be utilized to identify industry attractiveness not only for the products offered by the company but for the different business units such as whole product lines, services offered and even brands
- Since, a lot of factors are taken into consideration, the matrix gives a fair view of the company’s strength & weakness and, paints an accurate picture of the strategic steps that the company should take to harness their competitive advantage as well as improve their weak points
- It is visually easy to understand and provides more options to place a product as compared to the BCG Matrix, due to the inclusion of the “low” level on both axes
Disadvantages
The matrix considers a plethora of factors which makes it a little difficult to understand for novice or beginner level consultants and thus, poses the following drawbacks for the organizations:
- Industry attractiveness and Business unit strength has several interconnected factors which needs to be established as accurately as possible. Therefore, the matrix requires highly experienced consultants or subject matter experts to identify each factor and relative grade it on the matrix accurately
- Unlike BCG matrix, this matrix requires a lot of data, be it primary research or secondary research thus, it requires a lot of human effort, time and is costly to perform for smaller business units
- The matrix ignores the interdependency between different business units and can sometimes result in decision regarding one business unit that may or may not affect the results of an intertwined business unit
- The scoring criteria of the various factors accounted for the matrix is relative to the person and can result in biases according to the consultant’s prioritization of the various factors
- The matrix gives no picture of how to allocate the relative resources for each product or the business unit
Applications
GE-McKinsey nine box matrix finds application to firms having variety of business units, different brands, product lines and personalized products. Companies such as Unilever, ITC Limited, etc. use the matrix to find the correct product mix to bring in more customer acquisitions thereby, increasing their revenues significantly.
Case Study
For Example, the GE matrix played an important role in the product life of Foodles by Horlicks. It was introduced by HUL as a healthy substitute of rival Maggi by Nestle. Despite, Hindustan Unilever (HUL)’s aggressive marketing and promotional strategies, the product was not successful. Hence, this initiative falls in the bottom right of the matrix i.e., Divest category. The brand positioning of Horlicks would subsequently remain intact within the customers perception.
Case Study of Investment of Ford in its Electric Vehicle arm
A few years ago, Ford decided to not invest its resources in Research and Development (R&D) and Manufacturing of its electric vehicle, while all the other competitors were doing the same. The reasoning for Ford’s decision were:
- Ford had a core competency in manufacturing of traditional automobiles in which they have a strong presence but for the electric vehicle segment, their presence is at par with other competitors. The designing part of electric vehicles is also different from IC vehicles as they don’t have robust components such as power trains, fuel injected engines. Ford had no expertise in the area of electric vehicle manufacturing
- At that point of time, people still prefer to own a traditional Internal Combustion (IC) engine powered vehicle instead of electric vehicle i.e., the timeline was not booming for electric vehicle industry.
As per the recent trends, Governments across the globe are trying to shift to electric mobility solutions and Ford did its research for the industry as well as its internal capabilities using the GE-McKinsey matrix in the segment of electric vehicles which helped them make a sound decision to invest in the electric vehicle industry.
References


