Industry Analysis: Utilities


Utilities converts generation or purchased energy, networks, fuel, labor, capital and regulatory approvals into outputs that customers can purchase, regulate, finance, or operationalize. The strategic priority is to defend the point in the value chain where scarce capability, customer access, or operating scale creates pricing power. Margin tends to accrue to firms that control network ownership, regulated asset base, service territory, reliability and regulatory relationships, while standardized activity remains exposed to procurement and substitution. The sector matters because it coordinates generation, transmission, distribution, billing, balancing and service operations for households, businesses, industrial users, governments and wholesale market participants and its economics are being reshaped by grid modernization, distributed energy, storage, electrification, resilience and data-driven demand management. Bargaining power is shifting as technology changes distribution, regulation changes participation and customers gain more ways to compare or replace suppliers.
Is Utilities attractive for new entrants?
Entry can be attractive where a focused model exploits a specific gap in connections, billing, outage service, energy management and customer programs or lowers the cost of generation, transmission, distribution, billing, balancing and service operations. Broad entry is harder because incumbents already control network ownership, regulated asset base, service territory, reliability and regulatory relationships and established distribution.
Which parts of the value chain are most profitable?
Profit generally concentrates around scarce capabilities, differentiated customer interfaces, recurring relationships and assets that are difficult to replicate. In this sector, network ownership, regulated asset base, service territory, reliability and regulatory relationships is a central source of defensibility.
How is technology changing this industry?
Technology is changing the economics of generation, transmission, distribution, billing, balancing and service operations by reducing cycle time, increasing transparency, automating work, or changing distribution. The economic effect matters more than adoption counts.
What capabilities are table stakes versus differentiators?
Table stakes include reliable delivery, compliance, quality and basic commercial discipline. Differentiators are more likely to be specialized knowledge, integration, data, density, brand, or operating scale.
How should investors and consultants evaluate opportunities here?
Evaluate demand quality, pricing power, customer concentration, capital intensity, working capital, regulation and returns on incremental capital. Then test whether the apparent moat changes customer choice or competitor economics.
Where is bargaining power shifting?
Power shifts toward whichever side controls scarce supply, trusted customer access, infrastructure, or decision-relevant data. In Utilities, grid modernization, distributed energy, storage, electrification, resilience and data-driven demand management are changing that balance.
What makes a durable moat in this industry?
A durable moat combines a structural advantage with operating execution. The strongest candidates here are network ownership, regulated asset base, service territory, reliability and regulatory relationships.
Which cost metric matters most?
Management should connect the cost of generation, transmission, distribution, billing, balancing and service operations to utilization, throughput, quality, retention, or other operating drivers that determine contribution margin.
What should an incumbent defend first?
Defend the customer relationship and the operating capability that makes replacement costly. Avoid protecting low-return activity merely because it has historical scale.
What is the most common strategic mistake?
The common mistake is pursuing growth without identifying the mechanism that converts growth into better unit economics or stronger bargaining power. That can increase revenue while weakening returns.
Utilities can be analyzed as a set of linked economic stages rather than as a single market label. The sector coordinates generation or purchased energy, networks, fuel, labor, capital and regulatory approvals, transforms them through generation, transmission, distribution, billing, balancing and service operations and reaches customers through electric grids, gas networks, metering systems and customer channels. The strategic question is where value becomes scarce, who controls that scarcity and how technology or regulation can change the answer.
Industry at a glance
Definition and scope. This analysis covers regulated or market-based provision of electricity, natural gas and other utility network services; excludes upstream energy production and unrelated municipal services. The boundary matters because adjacent activities can have different regulation, capital intensity, customer economics and profit pools. Keeping the scope narrow makes the competitive diagnosis more useful for executives deciding where to invest, partner, automate, or exit.
Economic role. The sector serves households, businesses, industrial users, governments and wholesale market participants. It depends on generation or purchased energy, networks, fuel, labor, capital and regulatory approvals and reaches demand through electric grids, gas networks, metering systems and customer channels. Its output is valuable when it improves customer economics, reduces risk, increases access, or satisfies a requirement that customers cannot easily meet internally.1
Indicative metrics. Common revenue patterns include regulated tariffs, capacity payments, energy sales, connection fees and service contracts. Capital intensity is shaped by generation assets, transmission, distribution, meters, control systems and regulatory frameworks, while labor intensity depends on how much generation, transmission, distribution, billing, balancing and service operations can be standardized. Regulation intensity is driven by the cost of maintaining compliance, safety, data, licensing, or quality requirements.2
Industry segmentation
The sector separates into distinct operating models because customers buy different forms of value and because the location of scarce resources changes across the value chain. The relevant segments below are useful for comparing economics without treating the whole industry as one market.
-
Electric utilities: The segment emphasizes a different combination of generation or purchased energy, networks, fuel, labor, capital and regulatory approvals and customer requirements. Its economics depend on the degree of differentiation, operating scale and customer switching cost.
-
Natural gas utilities: The segment emphasizes a different combination of generation or purchased energy, networks, fuel, labor, capital and regulatory approvals and customer requirements. Its economics depend on the degree of differentiation, operating scale and customer switching cost.
-
Transmission and distribution: The segment emphasizes a different combination of generation or purchased energy, networks, fuel, labor, capital and regulatory approvals and customer requirements. Its economics depend on the degree of differentiation, operating scale and customer switching cost.
-
Municipal and cooperative utilities: The segment emphasizes a different combination of generation or purchased energy, networks, fuel, labor, capital and regulatory approvals and customer requirements. Its economics depend on the degree of differentiation, operating scale and customer switching cost.
-
Energy services and grid modernization: The segment emphasizes a different combination of generation or purchased energy, networks, fuel, labor, capital and regulatory approvals and customer requirements. Its economics depend on the degree of differentiation, operating scale and customer switching cost.
Market structure: Porter's Five Forces
The Five Forces analysis shows how network ownership, regulated asset base, service territory, reliability and regulatory relationships, customer concentration, supplier constraints and substitution interact. The forces are dynamic: technology can lower entry costs, regulation can raise them and consolidation can alter buyer and supplier power simultaneously. The objective is to identify which structural variable is most likely to change the industry's profit pool over the next planning cycle.3
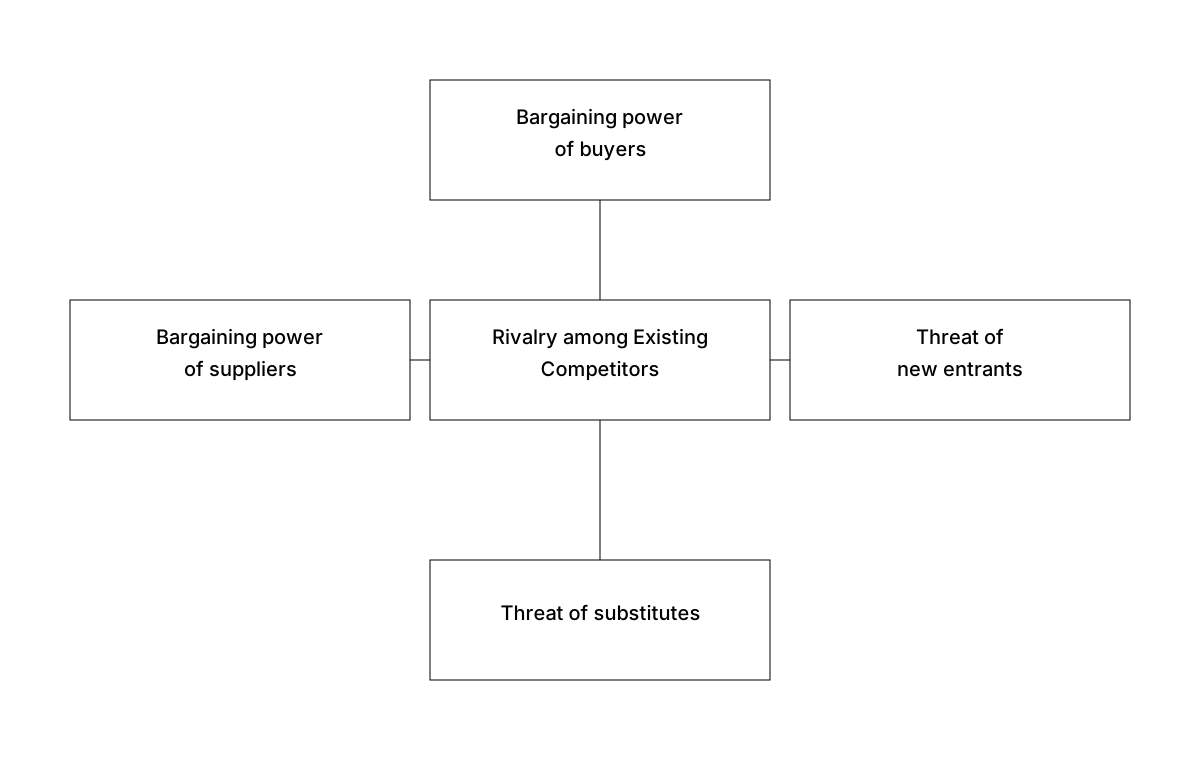
Bargaining power of buyers
Customer power in Utilities depends on concentration, switching cost, procurement sophistication and the consequences of service failure. Buyers include households, businesses, industrial users, governments and wholesale market participants. Large or professional buyers can pressure price when offers are comparable, but their leverage falls when a provider controls a scarce capability, delivers high reliability, or becomes embedded in connections, billing, outage service, energy management and customer programs. In this industry, the key variable is not buyer size alone. It is the buyer's credible outside option and the time required to move to it. Management should track renewal behavior, price realization, concentration and the share of revenue exposed to formal procurement.
| Dimension | Observation |
|---|---|
| Concentration | Large accounts can represent a material share of demand in households |
| Switching friction | Moving away from an embedded connections, billing, outage service, energy management and customer programs relationship can impose operational cost |
| Price transparency | Comparable offers make formal procurement more effective |
| Outcome sensitivity | Reliability and failure costs can outweigh headline price |
Bargaining power of suppliers
Supplier power in Utilities comes from the scarcity and substitutability of generation or purchased energy, networks, fuel, labor, capital and regulatory approvals. Critical suppliers may include people, technology vendors, infrastructure owners, raw-material producers, or regulated service providers. Power rises when qualification is slow, switching interrupts operations, or a supplier controls a bottleneck. It falls when the buyer can standardize specifications, dual-source, redesign the process, or build capability internally. The most exposed firms map supplier concentration to the economic cost of disruption rather than relying on a generic procurement score.
| Dimension | Observation |
|---|---|
| Input scarcity | generation or purchased energy, networks, fuel, labor, capital and regulatory approvals become leverage points when supply is specialized or constrained |
| Qualification time | Validation, training, or redesign can delay replacement |
| Concentration | A narrow supplier base can move margin upstream |
| Mitigation | Dual sourcing, redesign, integration, or long-term contracts can reduce exposure |
Rivalry among existing competitors
Rivalry is shaped by the number and strength of competitors, the degree of product differentiation, fixed costs and the intensity of customer switching. Firms compete across electric grids, gas networks, metering systems and customer channels and increasingly around network ownership, regulated asset base, service territory, reliability and regulatory relationships. High fixed costs or excess capacity can push competitors toward discounting. Strong differentiation can redirect rivalry toward quality, service, ecosystem access, or brand. Management should distinguish temporary price competition from a structural decline in willingness to pay.
| Dimension | Observation |
|---|---|
| Market shape | Scale players and focused specialists can compete in different segments |
| Differentiation | Competition can shift toward network ownership, regulated asset base, service territory, reliability and regulatory relationships rather than price |
| Capacity economics | High fixed costs can intensify price competition when demand weakens |
| Consolidation | M&A can change coverage, purchasing power and investment capacity |
Threat of new entrants
Entry into Utilities requires more than a product. A credible entrant must assemble generation assets, transmission, distribution, meters, control systems and regulatory frameworks and earn trust in a market where customers already have alternatives. Digital tools can reduce launch costs, but regulation, integration, capital requirements, customer acquisition and operating reliability can preserve incumbent advantages. Entry is most plausible when a new model removes a constraint, targets a neglected segment, or uses a lower-cost distribution mechanism. Incumbents should therefore monitor business-model innovation rather than only direct competitors.
| Dimension | Observation |
|---|---|
| Capital needs | Entry may require investment in generation assets, transmission, distribution, meters, control systems and regulatory frameworks |
| Credibility | References, approvals, or operating history can reduce buyer risk |
| Technology | Digital delivery can lower the cost of serving a narrow segment |
| Scale | Incumbents can spread compliance and platform costs across larger revenue bases |
Threat of substitutes
Substitution occurs when customers solve the underlying need through another product, workflow, technology, or internal capability. Relevant alternatives to Utilities can emerge from adjacent sectors and from changes in customer behavior. Substitution risk increases when the industry's output becomes standardized and easy to compare. It decreases when the service is embedded in a workflow, carries high failure costs, or depends on trusted infrastructure. Management should track the customer's total process and the economic attractiveness of alternatives, not just conventional competitors.
| Dimension | Observation |
|---|---|
| Internalization | Customers may bring selected activities in-house |
| Adjacent technology | New tools can alter the preferred workflow |
| Behavior change | Customers can change channels or consumption patterns |
| Integration | Deep embedding in connections, billing, outage service, energy management and customer programs can make replacement slower |
Value chain and profit pools
The value chain in Utilities can be read through five recurring stages: upstream inputs, production or processing, distribution and logistics, the customer interface and enabling infrastructure. The precise activities differ by segment, but the economic logic is consistent. Profit follows control over scarce resources, customer access, or operating density rather than following the number of activities a firm performs.
Upstream inputs
Generation or purchased energy, networks, fuel, labor, capital and regulatory approvals. The key question is whether supply is abundant, differentiated, or constrained. Qualification and switching costs can transfer bargaining power upstream. In Utilities, management should map revenue, contribution margin, working capital and capital employed to this stage instead of treating the industry as a single pool.
Production and processing
Generation, transmission, distribution, billing, balancing and service operations. Scale matters when it lowers unit cost, improves yield, or increases utilization. Automation matters when it changes the economics of the process rather than merely reducing headcount. In Utilities, management should map revenue, contribution margin, working capital and capital employed to this stage instead of treating the industry as a single pool.
Distribution and logistics
Electric grids, gas networks, metering systems and customer channels. Distribution creates advantage when density, reliability, speed, or access lowers the delivered cost of serving customers. In Utilities, management should map revenue, contribution margin, working capital and capital employed to this stage instead of treating the industry as a single pool.
Customer interface
Connections, billing, outage service, energy management and customer programs. The interface determines who owns the relationship, data, renewal decision and pricing conversation. This can capture more value than the underlying production step. In Utilities, management should map revenue, contribution margin, working capital and capital employed to this stage instead of treating the industry as a single pool.
Enabling infrastructure
Generation assets, transmission, distribution, meters, control systems and regulatory frameworks. Infrastructure can create barriers through standards, licenses, network access, financing, or compliance systems that competitors cannot reproduce quickly. In Utilities, management should map revenue, contribution margin, working capital and capital employed to this stage instead of treating the industry as a single pool.
Profit pool
Profit in Utilities tends to concentrate where customers face meaningful consequences from failure and where suppliers control scarce capability. That favors businesses with network ownership, regulated asset base, service territory, reliability and regulatory relationships. Standardized work remains necessary, but it is more exposed to procurement and substitution. Profit pools can shift when grid modernization, distributed energy, storage, electrification, resilience and data-driven demand management alter customer willingness to pay or change which capabilities are scarce.4
A useful management view separates transaction margin, recurring-service margin and the economic value of customer access. This prevents a common error: treating revenue growth as evidence that the firm controls the attractive part of the value chain. The better question is whether incremental revenue improves price realization, utilization, retention, or return on capital.
Industry economics and business models
Money is made in Utilities through a small set of recurring patterns. The sector supports regulated tariffs, capacity payments, energy sales, connection fees and service contracts. Each pattern allocates risk differently across demand, capacity, input prices and customer behavior. Fixed-price commitments transfer delivery risk to providers, while usage-based pricing shifts volume risk toward customers; recurring contracts can improve predictability but may constrain upside when market conditions move sharply.
Business model design should match the pricing unit to the economic value created. Customers may be buying capacity, access, certainty, expertise, performance, or an outcome. Pricing the wrong unit can increase revenue while adding service complexity and weakening returns.
Cost drivers & scalability
The main cost base includes fuel or purchased power, capital expenditure, maintenance, labor, financing and compliance. Fixed costs matter when facilities, platforms, specialist teams, or infrastructure must remain available regardless of volume. Variable costs rise with units, transactions, usage, or customer activity. The strategic task is to identify where scale lowers unit cost and where scale instead adds coordination cost.
Scale is valuable when it improves procurement, utilization, data density, network coverage, or service quality. Scope is valuable when one capability can support adjacent products without duplicating the cost base. The flywheel is strongest when better delivery improves trust or engagement, which improves retention and utilization, which then funds further process investment.
Unit economics should connect operating drivers to customer economics. Service models should monitor utilization, productive capacity, quality and retention. Digital models should track acquisition cost, infrastructure cost, engagement and lifetime value where applicable. Asset-heavy models should isolate throughput, yield, downtime and return on capital.
Moats, advantages and strategic levers
Defensibility in Utilities can come from cost advantage, differentiation, network effects, switching costs, regulatory access, or data and learning. The strongest sector-specific sources are network ownership, regulated asset base, service territory, reliability and regulatory relationships. A moat is credible only when it changes customer choice or competitor economics.
Cost advantage can arise from scale, location, process design, utilization, or procurement. Differentiation can come from quality, reliability, brand, specialized knowledge, or workflow integration. Network effects matter when additional users improve the value of the system, while switching costs arise when replacing a provider requires migration, retraining, qualification, redesign, or loss of accumulated data.
Regulatory moats are strongest when compliance requires time, evidence, or operating history. Data moats become meaningful when repeated activity improves prediction, quality, or workflow performance. Management should not label ordinary customer relationships as moats unless those relationships survive a credible competing offer.
Strategic levers
An entrant or incumbent can pull several levers, but each should be tied to a clear economic hypothesis. The objective is to improve price realization, lower delivered cost, increase retention, or gain control over a scarce input or customer interface.
Customer segment focus
Prioritize customers for whom network ownership, regulated asset base, service territory, reliability and regulatory relationships has measurable value rather than pursuing the largest theoretical market. The decision should have a measurable leading indicator and an explicit review point. Growth initiatives become expensive when management cannot state which structural variable they are changing.
Product scope
Decide whether to own the full workflow around generation, transmission, distribution, billing, balancing and service operations or dominate one high-value step. The decision should have a measurable leading indicator and an explicit review point. Growth initiatives become expensive when management cannot state which structural variable they are changing.
Integration versus partnering
Integrate when control of generation or purchased energy, networks, fuel, labor, capital and regulatory approvals or generation assets, transmission, distribution, meters, control systems and regulatory frameworks changes economics; partner when scale or access is more valuable than ownership. The decision should have a measurable leading indicator and an explicit review point. Growth initiatives become expensive when management cannot state which structural variable they are changing.
Geographic or channel expansion
Expand where customer density and supply conditions improve the economics of electric grids, gas networks, metering systems and customer channels. The decision should have a measurable leading indicator and an explicit review point. Growth initiatives become expensive when management cannot state which structural variable they are changing.
Ecosystem orchestration
Use standards, platforms, data, or partnerships to become a coordination point for connections, billing, outage service, energy management and customer programs. The decision should have a measurable leading indicator and an explicit review point. Growth initiatives become expensive when management cannot state which structural variable they are changing.
Structural risks, regulation and trends
Structural risk in Utilities comes from regulatory lag, extreme weather, fuel prices, capital requirements, cyber risk and changing load patterns. Regulatory change can alter who may participate, what evidence is required and which costs are unavoidable. Technology can change the relative economics of labor, capital, distribution, or customer acquisition. Supply shocks can change which side of the market holds bargaining power.5
Demand should be modeled through customer budgets, demographics, technology adoption, replacement cycles and regulatory requirements where relevant. Supply should be modeled through capacity additions, consolidation, labor availability, productivity and investment timing. That approach is more useful than relying on a single market forecast.
Three scenarios are useful. In the base case, grid modernization, distributed energy, storage, electrification, resilience and data-driven demand management continue at a measured pace and incumbents adapt. In a compression case, price transparency or automation reduces differentiation faster than expected. In a scarcity case, regulation, supply disruption, or concentrated capacity shifts power toward scarce resources. A resilient strategy remains viable across all three.
Strategic playbook
A new entrant should begin with a narrow customer problem where incumbent cost structures or workflows are poorly matched to the need. The wedge should exploit a specific friction in connections, billing, outage service, energy management and customer programs or a change created by grid modernization, distributed energy, storage, electrification, resilience and data-driven demand management. Build-versus-buy decisions should follow the source of defensibility. Proprietary process knowledge often favors internal development; broad infrastructure often favors partnerships.
Incumbents should defend the part of the business that owns customer trust and recurring economics, then redesign low-differentiation work. Technology investment should lower cycle time, error rates, or delivered cost without weakening the capability customers still value. Portfolio reviews should ask which products improve bargaining power and which simply add revenue.
Executives should establish leading indicators such as win rate, price realization, retention, supplier concentration, utilization, quality, working capital and return on incremental capital. Those measures reveal structural change earlier than revenue growth alone.
Management implications
The operating model in Utilities creates a second strategic question after the industry structure is understood: which decisions should management make differently because the economics are changing? The answer begins with the allocation of scarce resources. Firms should distinguish capacity that protects service reliability from capacity that merely adds volume and they should distinguish technology that changes unit economics from technology that only changes presentation. This distinction becomes especially important when customers can compare alternatives quickly. A business that responds to price pressure by adding features without reducing delivered cost can increase complexity without improving retention. A business that automates a process without redesigning the surrounding workflow can also preserve the same bottleneck under a different interface.
Management should connect commercial planning to operational constraints. Customer concentration, supplier concentration, utilization, cycle time, quality, working capital and capital intensity should appear in the same review because each can change the bargaining relationship. A customer with high annual spend may have less leverage if the service is deeply integrated, while a smaller customer may have considerable leverage when switching is immediate. Similarly, a supplier may appear replaceable on paper but become strategically important when qualification, reliability, or geographic constraints limit the practical alternatives. The management team should therefore measure the cost of changing the relationship, not just the number of available suppliers or customers.
Technology investment deserves the same discipline. The first question should be which economic constraint the investment removes. Automation can increase throughput, reduce error, or make a scarce skill less binding. Data can improve forecasting, pricing, or customer retention. Digital distribution can reduce acquisition cost while increasing platform dependence. These effects should be modeled separately. The resulting business case should include the cost of implementation, process redesign, training, cybersecurity and ongoing maintenance rather than treating software or equipment as a one-time purchase.
A useful planning cycle also separates structural changes from cyclical conditions. A temporary shortage can create attractive margins without creating a durable moat. A temporary demand surge can justify overtime without justifying permanent capacity. Conversely, a gradual shift in customer behavior can look small in annual reporting while materially changing the economics of a five-year asset. Management should therefore use leading indicators and scenario ranges, then revisit assumptions when utilization, price realization, retention, or supplier terms move outside the expected band.
The strategic implication is straightforward: protect the constraint that competitors cannot remove quickly and redesign everything that becomes standardized. That approach gives management a practical basis for deciding where to invest, where to partner and where to exit. It also makes the Five Forces analysis operational because each force can be tied to a measurable indicator rather than treated as a static label.
Decision framework
Executives can translate the industry diagnosis into a short sequence of decisions. First, identify the customer segment in which the company has the strongest right to win and define the economic reason for that advantage. Second, map the activities required to deliver the promise and isolate the activities that consume the most capital, labor, management attention, or scarce inputs. Third, test which of those activities customers actually value and which they would replace if a credible alternative appeared. This sequence prevents management from treating every part of the operating model as equally strategic.
The next step is to quantify the consequences of change. A shift in customer mix can alter utilization, payment terms, service requirements and acquisition cost. A shift in supplier structure can alter quality, lead times, inventory requirements and working capital. A technology change can reduce unit cost while increasing dependence on a platform or specialist vendor. These effects should appear in the same scenario model. Management can then see whether a proposed initiative strengthens the core economics or simply moves cost from one part of the value chain to another.
Portfolio choices should follow the same logic. Businesses with attractive growth but weak bargaining power may require a different strategy from businesses with modest growth and strong control of scarce resources. The former may justify investment in differentiation, distribution, or customer integration. The latter may justify selective capacity expansion or a stronger focus on recurring revenue. The key is to match the investment thesis to the structural position rather than using the same growth playbook across every segment.
The operating dashboard should also include early-warning indicators. Management should watch changes in customer concentration, win rates, renewal behavior, price realization, supplier lead times, capacity utilization, inventory days, quality performance and incremental capital returns. The exact measures differ across segments, but the principle remains constant: leading indicators reveal bargaining-power changes before they appear in reported revenue or profit. A company that sees those changes early can adjust sourcing, pricing, capacity, partnerships, or scope before competitors force the decision.
For Utilities, the strategic advantage ultimately comes from aligning the commercial model with the operational constraint. If the scarce resource is talent, the business should design around retention, productivity and selective automation. If it is infrastructure, management should optimize utilization and access. If it is customer trust, the company should deepen integration and prove outcomes. If it is distribution, density and service reliability become the central variables. This alignment turns industry analysis into an operating agenda and gives the board a clearer basis for deciding where the next unit of capital should go.
Caselet
Duke Energy: operating through structural change
History and operating model
Duke Energy provides a public example of how the economics of Utilities can be managed through changing market conditions. Its operating history can be examined through public filings, institutional disclosures and sector evidence. The case is useful because it connects strategic positioning to the practical constraints of generation or purchased energy, networks, fuel, labor, capital and regulatory approvals and generation assets, transmission, distribution, meters, control systems and regulatory frameworks. The organization developed an operating model around a specific customer need and then adjusted its capabilities as technology, regulation, competition, or demand changed.
The operating model shows why scale alone does not guarantee attractive returns. Management must decide which activities should remain proprietary, which can be standardized and which are better sourced from partners. In Utilities, those choices determine the balance between fixed cost, flexibility, service quality and customer control. The case also shows the value of sequencing investments:
capabilities that strengthen the customer interface can create the demand visibility needed to justify capacity or technology investments upstream
Industry dynamics
The case reflects the forces shaping Utilities. Customers can compare alternatives more easily when offers become standardized, while suppliers gain leverage when specialized inputs are scarce. Regulation can create both cost and protection, depending on whether compliance raises the cost of entry or simply adds overhead to every participant. Technology can reduce the cost of delivery while also lowering entry barriers. The company therefore has to decide whether technology is primarily a cost lever, a differentiation tool, or a new distribution channel.
Competitive pressure also changes with market maturity. Early growth can reward capacity expansion and customer acquisition, but later stages often reward utilization, retention, procurement discipline and portfolio selection. A company that continues to optimize for volume after the market becomes more competitive can create revenue without creating economic value. The case highlights the need to adjust operating priorities as the profit pool moves.
Value capture
The value-capture question is where Duke Energy earns returns relative to the broader value chain. The answer depends on control of network ownership, regulated asset base, service territory, reliability and regulatory relationships, not simply on market share. A firm can hold a large volume position while suppliers, platforms, or customer procurement functions capture much of the economics. Conversely, a focused provider can earn stronger returns when its capability is embedded in the customer's workflow or when replacement would impose meaningful operational risk.
Public evidence should therefore be read through unit economics rather than headline growth. Revenue growth matters when it improves utilization, lowers acquisition cost, strengthens purchasing power, or increases the value of a network or installed base. It matters less when growth requires disproportionate capital, discounts, incentives, or working capital. This distinction is central to evaluating strategic quality in Utilities.6
Strategic lesson
For executives in Utilities, the case supports a practical rule: invest around the constraint that competitors cannot remove quickly. That constraint may be access, trust, regulation, operating density, specialized knowledge, infrastructure, or data. Protect that constraint while using technology to reduce the cost of serving customers. Avoid copying the visible features of a successful incumbent without understanding the economic mechanism underneath them.
The case also shows why portfolio discipline matters. Attractive segments can change as technology lowers costs or regulation alters participation. Management should revisit the source of advantage whenever customer switching becomes easier or a supplier bottleneck becomes less scarce. A durable strategy keeps the organization close to the point where customer value and structural scarcity meet.
Utilities is an economic system built around generation, transmission, distribution, billing, balancing and service operations and the reliable delivery of value to households, businesses, industrial users, governments and wholesale market participants. Its profit pools favor firms that combine network ownership, regulated asset base, service territory, reliability and regulatory relationships with disciplined cost management. The principal pressures are regulatory lag, extreme weather, fuel prices, capital requirements, cyber risk and changing load patterns, while structural opportunity comes from grid modernization, distributed energy, storage, electrification, resilience and data-driven demand management. Strategic choices should center on segment focus, scope, integration, technology investment and control of the customer interface. Entrants should target a narrow constraint they can remove more efficiently than incumbents. Established firms should protect the relationships and capabilities that create switching friction while redesigning low-differentiation work.
Citation
Cite this article
Sridharan, M. A. (2019, November 25). Industry Analysis: Utilities. Think Insights. https://thinkinsights.net/strategy/industry-analysis-utilities (Accessed [[ACCESS_DATE]])
Sridharan, Mithun A. "Industry Analysis: Utilities." Think Insights, 25 Nov. 2019, https://thinkinsights.net/strategy/industry-analysis-utilities. Accessed [[ACCESS_DATE]].
Mithun A. Sridharan, "Industry Analysis: Utilities," Think Insights, November 25, 2019, https://thinkinsights.net/strategy/industry-analysis-utilities. Accessed [[ACCESS_DATE]].
Sridharan, M.A. (2019) 'Industry Analysis: Utilities', Think Insights. Available at: https://thinkinsights.net/strategy/industry-analysis-utilities (Accessed: [[ACCESS_DATE]]).
M. A. Sridharan, "Industry Analysis: Utilities," Think Insights, 2019. [Online]. Available: https://thinkinsights.net/strategy/industry-analysis-utilities. [Accessed: [[ACCESS_DATE]]].
Sridharan MA. Industry Analysis: Utilities. Think Insights. Published November 25, 2019. Accessed [[ACCESS_DATE]]. https://thinkinsights.net/strategy/industry-analysis-utilities
Test Your Knowledge
Industry Analysis: Utilities
Challenge yourself on the concepts from this article and see how well you understood them.
Subscribers get weekly quizzes and insights — subscribe free
Sponsor this article
Partner with Think Insights
Reach 50,000+ business leaders, consultants, and strategists. Feature your brand alongside expert articles on strategy, leadership, and digital transformation.
Become a Sponsor