Industry Analysis: Climate Tech


Capital is consolidating into fewer, larger climate tech bets and the winners are the businesses that control a physical bottleneck, not the ones with the cleverest software. Storage hardware, grid infrastructure and critical mineral processing now absorb the majority of venture and growth dollars, while early-stage software and carbon-adjacent tools are being squeezed on both funding and margin. Executives allocating capital or partnering into this space should prioritize companies with offtake contracts, permitted sites or proprietary process technology over those selling dashboards. Buyers, particularly utilities, data center operators and governments, are gaining pricing leverage as supply tightens, which means new entrants need a differentiated cost position or a regulatory foothold before they raise a scaling round, not after.
Is climate tech attractive for new entrants?
Attractiveness depends heavily on segment. Hardware and infrastructure niches, such as long-duration storage or industrial process heat, require large capital commitments and multi-year permitting timelines, which discourages casual entry but rewards patient, well-capitalized teams with a genuine cost or performance edge. Software and analytics niches remain easy to enter but are quickly commoditized, so durable attractiveness there depends on data lock-in or workflow embedding rather than the underlying algorithm.
Which parts of the value chain are most profitable?
Margin concentrates in mineral processing and refining, proprietary cell or component manufacturing and long-term asset ownership such as operating storage or generation projects under contracted revenue. Project development and pure integration or installation work, by contrast, tends to run on thin, competitive margins because the barriers to entry are lower and the work is more standardized.
How is technology changing this industry?
Artificial Intelligence is compressing materials discovery timelines, improving grid forecasting and enabling predictive maintenance across distributed assets, which lowers operating costs for owners of physical infrastructure. At the same time, the same AI boom is a demand driver in its own right, since data centers are pulling forward investment in generation, storage and grid interconnection technology faster than climate policy alone would have.
What capabilities are table stakes vs differentiators?
Basic engineering competence, safety certification and regulatory compliance are table stakes across every segment, as is the ability to model project economics accurately for financiers. Differentiators include proprietary process chemistry or manufacturing yield advantages, control over permitted sites or interconnection queue positions, long-term offtake relationships with credit-worthy buyers and the balance sheet strength to survive multi-year development cycles before revenue arrives.
How should investors or consultants evaluate opportunities here?
Evaluation should start with the physical or contractual asset the company controls, rather than the narrative around its mission, since climate framing alone does not translate into pricing power. Investors should weight offtake contract quality, exposure to a single policy lever, unit economics at scale rather than at pilot scale and the credibility of the balance sheet needed to reach commercial operation. Consultants advising corporates should separate genuine cost-reduction plays from compliance-driven purchases, since only the former sustains demand if subsidies shift.
What is driving consolidation among climate tech investors?
Later-stage growth capital increasingly favors businesses that have already de-risked technology and demonstrated a bankable revenue model, which pushes early-stage funding toward fewer, larger rounds and starves marginal players of follow-on capital. This dynamic rewards founders who reach commercial proof points quickly and disadvantages ventures still iterating on core technology risk.
Why are data centers reshaping climate tech demand?
Data center electricity demand has grown faster than utilities can build new generation and transmission, which has turned power availability into the binding constraint for both Artificial Intelligence expansion and decarbonization simultaneously. This has redirected capital toward firm, dispatchable clean generation, storage and grid software that can deliver power quickly, sometimes ahead of pure climate-driven investment.
How exposed is climate tech to policy risk?
Segments tied to direct subsidies, tax credits or mandates, such as electric vehicle purchase incentives or hydrogen production credits, carry meaningful exposure to legislative reversal, which has already been visible in the United States. Segments driven by underlying economics, such as battery storage that lowers grid costs regardless of climate framing, are comparatively more insulated because the buyer's incentive persists even if the policy language changes.
What separates a durable climate tech business from a subsidized one?
A durable business generates a cost or performance advantage that persists without the subsidy, even if the subsidy accelerates its initial scaling, whereas a subsidized business depends on the incentive to clear the price gap against incumbent alternatives permanently. Consultants and investors should stress test unit economics at expected post-subsidy price levels before treating current margins as representative.
Where is the next profit pool likely to open in this industry?
Grid interconnection and flexibility services, including software that manages distributed storage, demand response and virtual power plants, sit at the intersection of two durable demand drivers, electrification and data center growth and currently lack a dominant incumbent. Materials recycling and reprocessing, particularly for battery components, is also positioned to grow as the first generation of electric vehicle batteries and grid assets reaches end of life.
Climate technology has moved from a mission-driven niche of venture investing into a mainstream allocation for infrastructure funds, corporate strategics and sovereign capital and the shift in who is writing checks has changed what wins. The industry no longer rewards a compelling narrative about emissions avoided; it rewards control over a physical bottleneck, a contracted revenue stream or a manufacturing process that beats the cost curve of the technology it displaces. Understanding where the money actually accumulates and why, requires separating the industry's software-flavored edges from its capital-intensive core, since the two operate under almost opposite economic logic.
Industry at a glance
Climate tech, as analyzed here, spans the venture and growth-stage ecosystem building technologies that reduce greenhouse gas emissions or adapt infrastructure to a changing climate, covering clean energy generation and storage, electric and low-carbon mobility, industrial decarbonization processes, climate-focused enterprise software and the venture capital and growth equity firms that fund them. It excludes carbon accounting, offset markets and engineered carbon removal, which form a distinct value chain analyzed separately and it excludes incumbent utilities and oil majors except where they act as customers, acquirers or capital providers to the venture ecosystem. The customer base spans business-to-business (B2B) sales to utilities, manufacturers and data center operators, business-to-government (B2G) contracts tied to infrastructure and defense procurement and a smaller business-to-consumer (B2C) layer in electric vehicles and home energy products.
Global venture and growth investment into climate technology reached roughly 40.5 billion dollars in 2025, an 8 percent increase over the prior year and first-half 2026 funding climbed to around 26 billion dollars, up 55 percent year over year and the strongest first half since 2022, driven heavily by power infrastructure serving data centers1. The industry is capital intensive at its hardware and infrastructure core, where projects resemble project finance more than traditional venture bets and labor intensive at its software and services edges, where engineering and domain expertise substitute for capital. Regulatory intensity varies sharply by segment: energy generation, grid interconnection and vehicle manufacturing sit under dense permitting and safety regimes, while climate software largely operates under standard commercial and data protection rules. Revenue models range from long-term power purchase agreements and project finance returns in hardware segments, to subscription and usage-based pricing in software segments, to unit sales with service attachments in mobility and equipment.
Industry segmentation
The industry divides most usefully along five segments defined by technology function and value chain position rather than by mission language. Energy generation and storage covers renewable generation technology, battery chemistry, long-duration storage and grid-scale systems and it is the most capital-intensive segment, with rounds often structured as project finance rather than equity venture. Industrial decarbonization covers low-carbon processes for cement, steel, chemicals and manufacturing, along with the materials science and process engineering that make those processes viable at scale and smart manufacturing investment in this segment grew nearly 200 percent year over year in 2025 as Artificial Intelligence tools accelerated materials discovery2.
Mobility and transportation covers electric vehicles, charging infrastructure, fleet electrification and the battery supply chains that support them, spanning both consumer-facing and fleet-facing business models. Climate software and enterprise tools covers decarbonization planning platforms, energy management systems, grid forecasting and industrial supply chain visibility software sold on subscription terms to corporate and utility customers. Climate-focused capital itself forms a fifth segment worth analyzing separately, since specialist venture and growth funds increasingly shape which technologies reach commercial scale through the discipline, or lack of it, they apply to underwriting standards.
Market structure
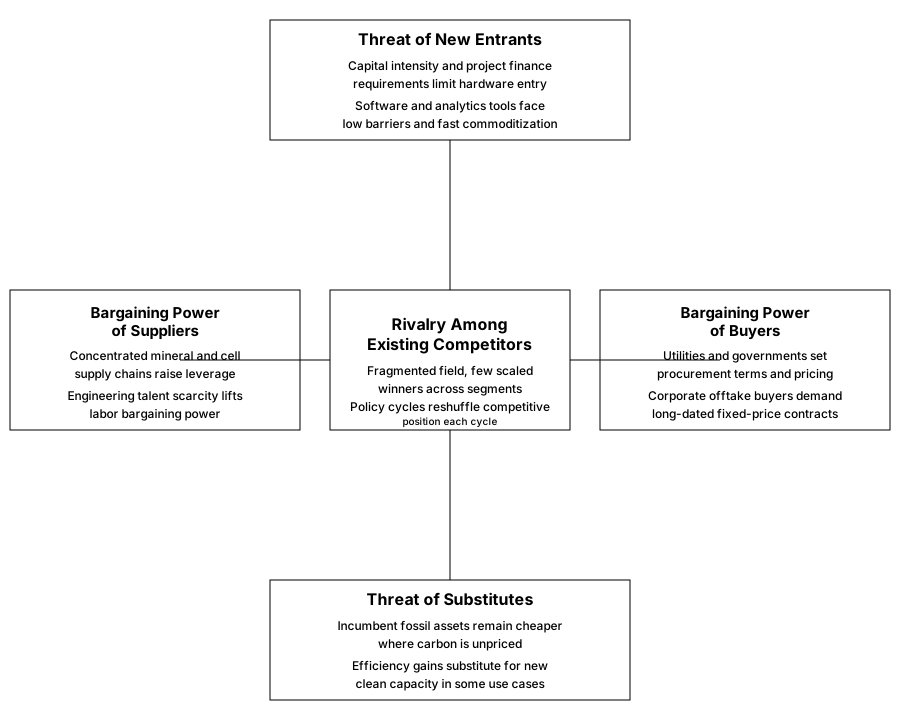
Industry dynamics differ sharply by segment, but five structural forces shape competitive intensity across the sector as a whole. Capital-intensive hardware and infrastructure segments behave like project finance and utility markets, with high entry barriers, concentrated supplier leverage over critical minerals and buyer power concentrated among a shrinking set of utilities, data center operators and governments. Software and services segments behave more like conventional enterprise technology markets, with lower entry barriers, faster commoditization and competitive intensity driven by feature parity rather than capital access. The following analysis walks through each force, drawing out where climate tech departs from a generic technology market and where it mirrors capital-intensive infrastructure industries instead.
Bargaining power of buyers
Buyer power in climate tech has strengthened considerably as the customer base has consolidated around a smaller number of large, sophisticated purchasers. Utilities, data center operators and government agencies now account for a growing share of hardware and infrastructure demand and each of these buyer categories negotiates from a position of scale that individual project developers rarely match. Corporate offtake buyers, particularly technology companies securing power for data centers, increasingly demand long-dated, fixed-price contracts that shift commodity and construction risk onto the seller, a structure that favors buyers with strong balance sheets and long planning horizons. Government buyers add another layer of complexity, since procurement cycles, domestic content requirements and permitting authority give public sector customers leverage well beyond their purchasing volume. Consumer-facing segments, notably electric vehicles, show more fragmented buyer power, since individual purchasers have limited negotiating leverage, though this is offset by intense price sensitivity and the availability of substitutes in the broader vehicle and appliance markets. Fleet buyers occupy a middle position, wielding meaningful volume leverage over vehicle and charging infrastructure providers while remaining more numerous and less coordinated than utility-scale buyers. The net effect is that companies selling into concentrated buyer segments, such as grid-scale storage or data center power, face persistent margin pressure unless they control a genuinely scarce input, while companies selling into fragmented consumer or small business markets retain more pricing latitude but must invest more heavily in demand generation.
| Buyer category | Typical leverage | Contracting pattern |
|---|---|---|
| Data center and hyperscale operators | Very high, concentrated demand | Long-term fixed-price power and capacity contracts |
| Utilities and grid operators | High, regulated procurement authority | Competitive solicitations and interconnection gating |
| Government and public agencies | High, permitting and subsidy control | Multi-year procurement with domestic content terms |
| Industrial and manufacturing buyers | Moderate, cost-driven adoption | Performance-based contracts tied to efficiency gains |
| Individual consumers | Low, fragmented and price sensitive | Point-of-sale purchase with financing options |
Bargaining power of suppliers
Supplier power is concentrated and rising in the segments most exposed to critical mineral and battery cell supply chains. A small number of countries and processing companies control the refining capacity for lithium, cobalt, nickel and rare earth elements that feed battery and magnet manufacturing, which gives upstream suppliers considerable leverage over downstream hardware companies, particularly during periods of tight supply. Semiconductor and specialized component suppliers hold similar leverage over grid electronics and power management systems, since qualification cycles for these components are long and switching suppliers midstream can delay project timelines by quarters. Skilled engineering and technical talent functions as a supplier category in its own right and scarcity in battery chemistry, power electronics and process engineering expertise has pushed compensation and equity demands upward, effectively raising the cost of the innovation input itself. Equipment manufacturers for specialized industrial processes, such as electrolyzers or advanced manufacturing tooling, also hold meaningful leverage where only a handful of vendors can supply at the required scale and specification. Companies that have integrated backward into mineral processing or component manufacturing, following the pattern set by leading battery recycling and materials firms, reduce this exposure but take on the capital intensity and operating complexity of running an industrial process rather than a lighter assembly or integration business. The result is that supplier concentration acts as both a risk and an opportunity, punishing companies dependent on a single-source input while rewarding those willing to build the processing capacity themselves.
| Supplier category | Concentration level | Strategic implication |
|---|---|---|
| Critical mineral processors and refiners | Very high, geographically concentrated | Long-term supply agreements and backward integration |
| Battery cell and component manufacturers | High, limited qualified vendors | Multi-year offtake and co-development contracts |
| Specialized engineering talent | High, scarce and mobile | Equity-heavy retention and internal training pipelines |
| Industrial equipment vendors | Moderate to high | Early vendor lock-in through capital equipment orders |
| Software and cloud infrastructure providers | Low to moderate | Standard commercial terms with switching flexibility |
Rivalry among existing competitors
Competitive rivalry varies enormously by segment maturity, but the overall industry remains fragmented, with few companies holding dominant share in any single niche. Energy storage and grid technology has consolidated somewhat around a handful of well-capitalized players who have proven manufacturing scale, yet new entrants continue to raise large rounds on the strength of chemistry or process claims that have not yet been validated commercially, keeping rivalry intense at the pre-scale stage. Climate software faces the most direct rivalry, since differentiation is difficult to sustain and competitors can replicate features quickly, pushing vendors toward vertical specialization, such as supply chain decarbonization for a specific manufacturing sector, to escape head-to-head feature competition. Industrial decarbonization technologies compete less against each other directly and more against the status quo cost of incumbent processes, meaning rivalry often plays out as a race to reach cost parity with conventional cement, steel or chemical production before capital runs out. Mobility rivalry is shaped by adjacent competition from large, well-capitalized automakers entering the electric segment, which raises the competitive bar for pure-play electric vehicle startups that lack manufacturing scale or brand equity. Policy cycles add a distinct rivalry dynamic unusual outside regulated industries, since a change in subsidy structure or emissions mandate can reorder competitive position within a single legislative cycle, rewarding companies with diversified geographic exposure over those dependent on a single jurisdiction's incentive regime.
| Competitive dimension | Current dynamic | Strategic response observed |
|---|---|---|
| Storage and grid technology | Moderate consolidation among scaled players | Vertical integration into materials and manufacturing |
| Climate software | High feature-level competition | Vertical specialization by industry or use case |
| Industrial decarbonization | Competition against incumbent cost baseline | Partnership with existing industrial operators |
| Mobility and vehicles | Rising pressure from diversified automakers | Focus on fleet and commercial niches |
| Cross-segment | Policy-driven reordering of position | Geographic diversification of revenue |
Threat of new entrants
Entry barriers diverge sharply between the industry's hardware and software halves. Hardware and infrastructure segments carry substantial barriers, including capital requirements that can run into hundreds of millions of dollars before first commercial revenue, multi-year permitting and interconnection queues and the need for bankable engineering credentials to secure project financing at all, which together discourage casual entry and favor teams with prior industrial or utility experience. Battery and materials processing carries an additional barrier in the form of technical qualification cycles, since automakers and utilities will not commit to a new supplier without extensive testing, which can take years and delay revenue well beyond the point at which a startup's initial capital runs out. Climate software, by contrast, carries comparatively low barriers, since cloud infrastructure and open-source tooling let a small team build a credible minimum viable product quickly, though customer acquisition costs and the difficulty of displacing an incumbent enterprise system act as softer barriers that slow scaling even after a product is built. Government funding programs and grants can lower the effective capital barrier for early-stage hardware entrants in some jurisdictions, though these programs are themselves subject to political cycles and can withdraw support abruptly. The overall pattern favors entrants who can either raise substantial early capital and secure a permitted site or offtake agreement before competitors do, or who can identify a software niche narrow enough to avoid direct competition with better-funded incumbents.
| Entry barrier factor | Hardware and infrastructure | Software and services |
|---|---|---|
| Capital requirement to reach revenue | Very high | Low to moderate |
| Permitting and regulatory timeline | Multi-year | Minimal |
| Customer qualification cycle | Long, technically rigorous | Short, sales-cycle driven |
| Government incentive exposure | Significant | Limited |
| Time to competitive product | Years | Months |
Threat of substitutes
Substitution risk in climate tech operates on two levels: substitution by incumbent, higher-emission alternatives and substitution among competing clean technologies themselves. Incumbent fossil-based generation, conventional vehicles and traditional industrial processes remain the default substitute wherever carbon is not priced explicitly and their embedded infrastructure, established supply chains and lower near-term capital cost make them a persistent competitive threat, particularly during periods of policy uncertainty or high interest rates that raise the cost of capital-intensive clean alternatives. Within climate tech itself, competing technologies frequently substitute for one another before any one approach reaches dominant scale, as seen in the shifting balance between lithium-based and alternative battery chemistries, or between electrification and hydrogen pathways for industrial heat, which means capital committed to one technology bet can be stranded if a competing approach achieves a decisive cost breakthrough first. Efficiency improvements represent a quieter substitution threat, since reducing energy or material consumption can substitute for the need to add new clean capacity altogether, softening demand growth for generation and storage providers even as overall decarbonization progresses. Demand-side flexibility and behavioral shifts, such as shifting electricity use to off-peak hours, similarly substitute for physical infrastructure investment in some grid contexts. Companies most exposed to substitution risk are those whose value proposition rests primarily on a policy-driven cost gap rather than a genuine underlying performance or cost advantage, since that gap narrows or reverses if the policy support changes.
| Substitute type | Exposure driver | Segment most exposed |
|---|---|---|
| Incumbent fossil-based alternatives | Unpriced carbon and low capital cost | Generation and industrial process heat |
| Competing clean technology pathways | Unresolved technology winner | Battery chemistry and hydrogen |
| Efficiency and demand reduction | Lower need for new capacity | Storage and generation |
| Demand-side flexibility | Software substituting for hardware | Grid infrastructure |
| Legacy vehicle fleets | Slower fleet turnover than projected | Mobility and charging |
Value chain and profit pools
The climate tech value chain runs across six functional stages that together determine where economic value is created and where it is actually captured. Upstream inputs cover critical mineral extraction and refining, specialized components such as battery cells and power electronics and the engineering talent pool that designs new processes and products. Research and technology development follows, covering the laboratory and pilot-stage work that converts a scientific insight into a manufacturable product, a stage that consumes significant capital without generating revenue and where most technology risk is resolved or fails. Manufacturing and production covers the conversion of inputs into finished hardware, whether battery cells, solar components or industrial equipment and this stage carries the heaviest fixed-asset investment in the entire chain. Project development and deployment covers the site selection, permitting, financing and construction work needed to bring generation, storage or industrial facilities online, a stage requiring specialized financial engineering as much as technical expertise. Distribution and customer interface covers sales, installation and ongoing service relationships with end customers, ranging from utility contract negotiation to consumer vehicle dealerships. Enabling infrastructure and software closes the chain, covering the grid connections, data platforms and monitoring systems that let physical assets operate efficiently once deployed.
Profit pool
Profit concentrates most heavily in mineral processing and refining, proprietary manufacturing with genuine yield or cost advantages and long-duration asset ownership under contracted revenue, while project development and pure distribution work runs on comparatively thin margins because those stages are more commoditized and more exposed to competitive bidding. This represents a meaningful shift from the industry's earlier years, when venture capital rewarded technology development and pilot-stage demonstration heavily, often ahead of any proof that the underlying unit economics would work at commercial scale. Investors have since moved decisively toward later-stage, larger rounds concentrated in businesses that have already resolved technology risk and secured contracted revenue, with average round sizes climbing from roughly 18 million dollars to 27 million dollars even as total deal count fell to a multi-year low3. Power infrastructure serving data center demand has become an especially concentrated profit pool, since the willingness of technology companies to sign long-term, high-value power contracts has made generation and storage assets serving that demand more valuable than equivalent assets serving traditional grid load. Companies that own a physical bottleneck, whether a permitted site, a processing facility or a contracted offtake agreement, capture disproportionate value relative to companies that merely integrate or resell technology built by others.
Industry economics and business models
Four business model patterns dominate the industry, each with distinct capital and margin characteristics. Asset-heavy infrastructure models, common in generation, storage and industrial decarbonization, generate revenue through long-term contracts or power purchase agreements and depend on access to project finance and construction expertise as much as on the underlying technology, with returns realized over years rather than quarters. Manufacturing and hardware sales models, common in batteries, components and vehicles, generate revenue through unit sales with service and warranty attachments and profitability depends heavily on manufacturing yield, scale economics and supply chain control. Subscription and usage-based software models, common in climate SaaS and grid analytics, generate recurring revenue from enterprise customers and depend on customer acquisition efficiency and retention rather than physical asset ownership, mirroring conventional enterprise technology economics. Fund and capital allocation models, applied by climate-focused venture and growth investors, generate returns through equity appreciation and carried interest and their economics depend on underwriting discipline and portfolio construction rather than operating a product directly, though their capital allocation choices materially shape which of the other three models succeed at scale.
Cost drivers and scalability
Cost structure diverges sharply between the industry's asset-heavy and asset-light segments. Hardware and infrastructure businesses carry high fixed costs in the form of manufacturing facilities, project construction and permitting overhead, which means profitability depends on reaching sufficient production or generation volume to spread those fixed costs and economies of scale are substantial once a facility reaches design capacity. Variable costs in these segments are dominated by input materials, particularly critical minerals and specialized components, making unit economics highly sensitive to commodity price swings and supply chain disruption. Software businesses carry a more conventional cost structure, with engineering and customer acquisition as the dominant costs and marginal delivery cost approaching zero once a platform is built, though the customer base in climate software tends to be smaller and more specialized than in general enterprise software, limiting the scale advantages available. A useful framing for hardware businesses is capacity utilization, since a facility running below design capacity destroys unit economics quickly, much as load factor governs profitability in airlines or hotels. For contracted infrastructure assets, the equivalent discipline is the spread between contracted revenue and the levelized cost of the underlying technology, a spread that narrows as competition for offtake intensifies but widens for owners of genuinely differentiated, lower-cost technology. Growth loops in this industry tend to be capital loops rather than viral or network loops, where early commercial proof points unlock larger project finance, which funds capacity expansion, which in turn improves unit costs enough to win the next contract.
Moats, advantages and strategic levers
Defensibility in climate tech rests on a narrower set of levers than in general technology markets and the strongest moats are physical or contractual rather than purely digital. Cost advantage built on proprietary process technology or manufacturing yield is the most durable moat in hardware and industrial segments, since a genuine cost edge persists even if policy support changes, unlike advantages that depend entirely on a subsidy. Control over scarce physical assets, including permitted sites, interconnection queue positions and long-term mineral supply agreements, functions as a structural moat because these assets cannot be replicated quickly regardless of a competitor's capital access. Regulatory moats exist where domestic content requirements, safety certifications or environmental permits create genuine switching costs for buyers, particularly government and utility customers who face their own compliance obligations. Switching costs in enterprise software climate tools arise from data integration depth and workflow embedding within a customer's operations, though these costs are generally weaker than in adjacent enterprise software categories because climate data platforms are still relatively young and less entrenched. Data and learning advantages accrue to companies operating at meaningful commercial scale, since operating data from thousands of installed assets improves forecasting, maintenance and underwriting models in ways that a company with only pilot-scale deployment cannot replicate quickly.
Strategic levers
Companies and investors operating in this industry can pull five distinct levers to build position. Customer segment focus, choosing between utility-scale, corporate and consumer buyers, determines contract structure, sales cycle length and capital intensity and the strongest performers tend to concentrate rather than spread across all three. Vertical integration versus partnering, particularly the decision to build mineral processing or manufacturing capacity internally versus contracting with specialists, trades capital intensity and control against speed and flexibility and the right choice depends heavily on whether the company's advantage lies in the process itself or in downstream integration and service. Geographic expansion carries distinct value in this industry because policy support, permitting speed and grid characteristics vary enormously by jurisdiction, so companies that diversify across regulatory regimes reduce exposure to any single policy reversal. Offtake and contracting strategy, securing long-term revenue commitments before committing capital to construction, separates bankable infrastructure businesses from speculative ones and increasingly determines which companies can access project finance at all. Ecosystem orchestration, positioning as the platform or integrator that coordinates multiple technology providers around a shared customer outcome, offers a lower-capital path to relevance for companies unwilling or unable to compete on manufacturing scale directly.
Structural risks, regulation and trends
Climate tech carries four categories of structural risk that any strategic assessment needs to weight explicitly. Regulatory risk is the most acute, since large segments of the industry depend on subsidies, tax credits or mandates that can be altered or withdrawn within a single legislative cycle, a risk that materialized visibly in the United States as policy support for electric vehicles and certain manufacturing incentives shifted. Technology disruption risk runs in both directions, since a competing chemistry or process can strand capital committed to an earlier approach, but also because breakthrough cost reductions can suddenly make previously uneconomic segments viable, rewarding fast movers. Commodity and price risk stems from concentrated mineral supply chains, where geopolitical tension or export restrictions can disrupt input availability with little warning. Geopolitical and supply chain risk compounds this further, since much of the refining capacity for critical minerals sits in a small number of countries, creating exposure to trade policy and diplomatic relationships well beyond the control of any individual company.
Two secular trends are reshaping demand more powerfully than climate policy alone. Electricity demand growth from data centers and Artificial Intelligence infrastructure has become a primary driver of investment in generation, storage and grid technology, sometimes outweighing pure decarbonization motives in determining which projects get financed first4. Capital concentration among later-stage, de-risked businesses is narrowing the funnel of companies able to reach commercial scale, which raises the bar for new entrants but also reduces the number of undercapitalized competitors dragging down pricing in mature segments.
The businesses winning capital today are the ones that solved a physical constraint, not the ones that automated a spreadsheet
For companies entering this industry, the strategic playbook depends heavily on capital access and technical differentiation. A niche entry strategy, focusing on a narrow industrial vertical or a specific geography with favorable permitting, suits teams with limited capital but strong domain expertise, while a broad entry strategy suits teams that can raise substantial capital upfront and want to establish scale advantages before competitors close the gap. The build, partner or acquire decision hinges on whether the differentiating asset is proprietary technology, which favors building, or market access and distribution, which often favors partnering with an established industrial player. Regulatory strategy deserves explicit attention rather than an afterthought, since companies that engage early with permitting authorities and structure operations around durable, not just currently subsidized, economics fare better through policy cycles. Incumbents defending position should prioritize deepening physical and contractual moats, expanding into adjacent segments where existing infrastructure or customer relationships transfer and using scale to negotiate better mineral and component supply terms than newer entrants can access.
Redwood Materials and the economics of vertical integration
Redwood Materials illustrates how vertical integration reshapes profit capture in a capital-intensive climate tech segment. Founded in 2017 by JB Straubel, Tesla's former chief technology officer, alongside Andrew Stevenson, the company set out to build what it describes as a circular supply chain for lithium-ion batteries, starting with recycling end-of-life electric vehicle batteries and manufacturing scrap5. Rather than remaining a specialist recycler competing on volume and price, the company deliberately built capability across three linked stages of the value chain:
repurposing used batteries for grid-scale energy storage applications, recycling and refining recovered metals into battery-grade materials and manufacturing cathode active material used directly in new battery cells
This integrated structure matters because each stage individually carries different margin characteristics and Redwood's positioning lets it capture value across all three rather than ceding the higher-margin refining and materials manufacturing stages to separate specialist companies. Pure recycling, treated as a standalone business, tends to run on relatively thin margins, since collection and processing logistics are largely commoditized. Refining and cathode material manufacturing carry substantially better economics, since they require proprietary process technology and meet the stringent purity specifications that battery manufacturers demand, creating a genuine technical barrier rather than a purely operational one. By spanning both ends, Redwood converts what could have been a logistics business into a materials science and manufacturing business, which is precisely the profit pool this analysis identifies as the most attractive in the broader industry.
The company's growth has been financed accordingly, reflecting the capital intensity that defines infrastructure-grade climate tech. Redwood raised close to 2 billion dollars in equity since founding and secured a 2 billion dollar loan commitment to build out battery materials production capacity in Nevada, later announcing a further 3.5 billion dollar campus in South Carolina designed to eventually process 100 gigawatt-hours of battery anode and cathode material annually6. That scale of capital commitment would be difficult to justify for a company operating only at the recycling stage, but becomes rational once the target is materials manufacturing capacity serving the entire domestic battery supply chain, illustrating how vertical integration changes not just margin capture but also the scale of financing a company can credibly raise.
Redwood's customer relationships further demonstrate the buyer dynamics described earlier in this analysis. Automakers, including Ford, Volvo and General Motors, have partnered with the company for battery recycling and scrap material programs, motivated partly by sustainability goals but more concretely by the need to meet domestic sourcing requirements for battery materials and reduce exposure to volatile global mineral supply chains. This buyer motivation, procurement security and regulatory compliance rather than climate mission alone, mirrors the industry-wide pattern in which the most durable demand comes from customers who need the underlying economic or compliance outcome regardless of how the transaction is framed publicly. Redwood has also extended into adjacent applications, deploying repurposed batteries in grid-scale energy storage projects, including installations serving data center power demand, which places the company directly at the intersection of the industry's two strongest current demand drivers:
electrification and computing-driven electricity growth
The company's trajectory offers a template rather than a guarantee. Its position depends on continuing to secure feedstock at competitive cost, maintaining process yields that justify its capital investment and sustaining automaker relationships that could shift if a competitor secures better terms or a battery chemistry emerges that reduces the value of current recycling processes. That exposure to technology and relationship risk, even for a well-capitalized, vertically integrated leader, underscores that no position in this industry is permanently defensible without continued reinvestment in process technology and customer relationships.
Climate technology now functions as critical infrastructure for two converging demands: decarbonization mandates and surging electricity consumption from computing. Its economics reward capital discipline over growth-at-any-cost, favor vertically integrated players who own a physical chokepoint and punish businesses that mistake a software layer for a defensible moat. The industry's main strategic levers are site control, offtake contracting, process yield and policy fluency, applied in combination rather than isolation. Boards evaluating exposure to this sector should treat it as an infrastructure and materials allocation decision first and a technology bet second, since the companies capturing margin today are those that solved a physical constraint, not those that automated a spreadsheet.
Citation
Cite this article
Sridharan, M. A. (2023, February 9). Industry Analysis: Climate Tech. Think Insights. https://thinkinsights.net/strategy/industry-analysis-climate-tech (Accessed [[ACCESS_DATE]])
Sridharan, Mithun A. "Industry Analysis: Climate Tech." Think Insights, 9 Feb. 2023, https://thinkinsights.net/strategy/industry-analysis-climate-tech. Accessed [[ACCESS_DATE]].
Mithun A. Sridharan, "Industry Analysis: Climate Tech," Think Insights, February 9, 2023, https://thinkinsights.net/strategy/industry-analysis-climate-tech. Accessed [[ACCESS_DATE]].
Sridharan, M.A. (2023) 'Industry Analysis: Climate Tech', Think Insights. Available at: https://thinkinsights.net/strategy/industry-analysis-climate-tech (Accessed: [[ACCESS_DATE]]).
M. A. Sridharan, "Industry Analysis: Climate Tech," Think Insights, 2023. [Online]. Available: https://thinkinsights.net/strategy/industry-analysis-climate-tech. [Accessed: [[ACCESS_DATE]]].
Sridharan MA. Industry Analysis: Climate Tech. Think Insights. Published February 9, 2023. Accessed [[ACCESS_DATE]]. https://thinkinsights.net/strategy/industry-analysis-climate-tech
Test Your Knowledge
Industry Analysis: Climate Tech
Challenge yourself on the concepts from this article and see how well you understood them.
Subscribers get weekly quizzes and insights — subscribe free
Sponsor this article
Partner with Think Insights
Reach 50,000+ business leaders, consultants, and strategists. Feature your brand alongside expert articles on strategy, leadership, and digital transformation.
Become a Sponsor