Industry Analysis: Broadcast Media


Broadcast television and radio still generate tens of billions of dollars a year by selling audiences to advertisers and selling carriage rights to pay TV distributors, but the mix has flipped: distribution fees, not advertising, now anchor station economics. Consolidators that own local affiliates in strong markets, led by groups such as Nexstar Media Group and Gray Media, capture the widest margins because scale lets them negotiate retransmission rates and absorb network reverse-compensation demands that smaller independents cannot. The board-level decision is not whether to defend linear advertising, which is structurally declining, but how fast to convert station groups into local information and sports monopolies protected by spectrum scarcity, while renegotiating network affiliation and carriage agreements before the next cord-cutting wave erodes the subscriber base those fees depend on. Regulatory loosening of ownership caps in 2026 makes consolidation the primary lever available to incumbents right now.
Is broadcast media attractive for new entrants?
Broadcast media is unattractive for entrants seeking to build a station from scratch because usable spectrum is fully allocated, Federal Communications Commission [FCC] licenses in desirable markets rarely become available and any new signal competes against incumbents who already hold network affiliations and decades of local audience habit. The realistic entry path is acquisition of existing licenses or minority investment in station groups, not greenfield build and even acquisition requires clearing antitrust review that has grown more contested as consolidation accelerates.
Which parts of the value chain are most profitable?
Distribution economics, specifically retransmission consent and virtual multichannel video programming distributor [vMVPD] carriage fees paid to station owners, generate the highest and most durable margins, followed by the production of local news and live sports rights that anchor appointment viewing. Owned-and-operated stations in top-25 markets and national networks that hold marquee sports packages capture disproportionate profit relative to smaller affiliates and syndicated content producers.
How is technology changing this industry?
ATSC 3.0, marketed as NextGen TV, allows broadcasters to deliver better picture quality, targeted advertising and datacasting services over the same spectrum, opening new revenue lines beyond traditional advertising and retransmission. Streaming distribution, connected television advertising technology and programmatic ad buying are simultaneously eroding linear advertising's share of budgets, forcing broadcasters to build digital simulcast and addressable advertising capabilities to defend revenue.
What capabilities are table stakes vs differentiators?
Holding a network affiliation, maintaining FCC license compliance and operating a functioning master control and news production operation are table stakes that every station needs simply to operate. Differentiators include negotiating leverage in retransmission talks born of market density, proprietary local news franchises that audiences cannot get elsewhere, exclusive live sports or political advertising share and early, competent execution of ATSC 3.0 datacasting and addressable advertising.
How should investors or consultants evaluate opportunities here?
Evaluate station groups on the durability and growth trajectory of distribution revenue relative to advertising, the number of markets where the group holds duopoly or triopoly positions, leverage and debt maturity given the sector's heavy reliance on borrowed capital for acquisitions and exposure to political advertising cycles that inflate even-year results. Consultants should also weight regulatory trajectory heavily, since a single FCC ownership rule change can reprice an entire sector's consolidation potential overnight, as happened in 2026.
Why do retransmission fees matter more than advertising now?
Retransmission and vMVPD carriage fees have become the more predictable and faster-growing revenue line for station owners even as the subscriber base they are drawn from shrinks, because per-subscriber rates have risen faster than subscriber losses have cut into the base. Advertising, by contrast, faces both cyclical pressure and structural migration to digital and streaming inventory, making it the less reliable of the industry's two main revenue streams.
What is reverse compensation and why does it squeeze station margins?
Reverse compensation is the payment that local affiliates make back to their parent networks in exchange for the right to air network programming and it has grown to consume a large share, sometimes more than half, of the retransmission revenue a station collects from distributors. This transfer shifts economic power from local station owners toward the four major networks, even though it is the local stations that hold the spectrum licenses and negotiate directly with cable and satellite operators.
Can radio broadcasting survive the shift to streaming audio?
Radio retains structural advantages that streaming audio does not fully replicate, including free over-the-air access without a data plan or subscription, in-car dominance and a local advertising sales relationship that small businesses still value and companies such as iHeartMedia have offset broadcast softness with double-digit digital and podcast revenue growth. The format is not disappearing, but its center of gravity is shifting from pure spot advertising toward a hybrid of broadcast, digital audio and podcast monetization.
How does political advertising affect broadcast station valuations?
Political advertising spending concentrates in even-numbered election years and can add several hundred million dollars of high-margin, non-cancelable revenue to a large station group's results, which is why broadcast valuations and cash flow guidance swing on a two-year cycle. Investors need to normalize station group earnings across the full cycle rather than extrapolating from a single strong political year, since the odd-year comedown is structural and predictable.
What happens to broadcast media if cord-cutting continues at the current pace?
If pay television subscriptions keep declining at recent rates, the subscriber base funding retransmission fees will keep shrinking even as per-subscriber rates rise, eventually reaching a point where rate increases can no longer offset subscriber losses, a dynamic some industry analysts already describe as approaching for smaller station groups. The offsetting bet incumbents are making is that live sports, news and emergency information keep enough of the remaining audience tethered to linear and virtual pay television that distribution revenue stabilizes at a lower, but still substantial, base.
Broadcast media is the business of aggregating audiences around licensed television and radio spectrum and cable or satellite carriage of that spectrum, then selling access to that audience twice: once to advertisers who want attention and once to distributors who pay for the right to carry the signal. It is one of the oldest mass media businesses in existence, built on a scarce public resource, the electromagnetic spectrum, that governments allocate through licensing rather than markets. That scarcity has always been the industry's foundational advantage and its central regulatory tension and it remains the reason broadcast media still generates tens of billions of dollars in annual revenue even as streaming reshapes how people spend their viewing time.
Industry at a glance
Broadcast media, for the purposes of this analysis, covers over-the-air television and radio stations, the national networks that supply them programming, the cable and satellite systems that retransmit their signals and the commercial relationships, advertising sales, retransmission consent, network affiliation and syndication, that connect them. It excludes subscription streaming platforms as a primary subject, though streaming enters the analysis as a competitive substitute and a distribution channel that broadcasters themselves increasingly use to simulcast content. The industry serves three distinct customer types simultaneously. Advertisers, ranging from local car dealerships to national consumer brands to political campaigns, are business-to-business (B2B) customers who buy audience attention in thirty-second increments. Pay television distributors, cable operators, satellite providers and virtual multichannel video programming distributors [vMVPDs] such as internet-delivered live TV bundles, are also B2B customers who pay retransmission or carriage fees for the right to include broadcast signals in their packages. Viewers and listeners are the business-to-consumer (B2C) side of the equation, consuming content for free over the air or as part of a pay television subscription and their aggregate attention is what gets sold to the first two groups.
The industry is heavily dependent on adjacent sectors for its economic health. Local advertising revenue tracks regional retail, automotive and real estate activity, national advertising tracks broader consumer spending cycles and political advertising, a swing factor unique to this industry, tracks the electoral calendar and campaign finance flows. Retransmission revenue depends entirely on the health of the pay television sector, which means broadcast station economics are indirectly exposed to cable and satellite subscriber trends even though stations themselves do not operate distribution infrastructure. Capital intensity is moderate for a media business: transmission towers, studio facilities and news-gathering equipment require sustained investment, but the heavier capital commitment in recent years has gone toward acquiring station licenses and stations themselves rather than building new physical plant, given that spectrum is essentially fixed in supply. Labor intensity remains meaningful, particularly in local news production, where reporters, anchors, producers and engineers form the core cost base of a station's newsroom. Regulatory intensity is unusually high relative to other media segments, since the FCC controls license renewals, ownership limits and the rules governing retransmission consent and network affiliation, making regulatory relationships a genuine strategic asset rather than a compliance afterthought.
Revenue models split cleanly into two streams that this analysis returns to repeatedly: advertising, which is volume and rate driven and cyclically sensitive and distribution or carriage fees, which are contractually negotiated in multiyear cycles and have become the steadier of the two. Nexstar Media Group, the largest television station owner in the United States, generated 59% of its 2025 revenue from distribution fees and roughly 40% from advertising, a split that would have been reversed a decade earlier, illustrating how far the center of gravity has moved1. That shift did not happen because advertising vanished, but because it grew slowly or declined while distribution fees, priced on a per-subscriber basis and renegotiated every few years, kept climbing even against a shrinking subscriber count.
Industry segmentation
The industry divides into six segments organized primarily by value chain position and secondarily by ownership structure. National broadcast networks, ABC, CBS, NBC and Fox chief among them, produce and license prime-time and daytime programming, own a portfolio of owned-and-operated stations in the largest markets and set the affiliation terms that hundreds of independently owned local stations must accept to carry network content. Local affiliate station groups, publicly traded consolidators such as Nexstar, Gray Media, Sinclair and Tegna prior to its 2026 acquisition, own the physical stations in mid-size and small markets, sell local advertising, produce local news and negotiate retransmission agreements directly with pay television distributors. Cable and satellite networks, a distinct segment from over-the-air broadcast but closely intertwined through carriage economics, produce or license programming distributed exclusively through pay television bundles rather than free over-the-air signal and depend on affiliate fees paid by distributors regardless of whether a subscriber ever tunes in. Radio broadcasting groups, led by iHeartMedia, Audacy and Cumulus Media, operate a parallel structure built on the same spectrum-scarcity logic but monetize almost entirely through advertising rather than distribution fees, since radio has no retransmission consent equivalent. Program syndicators and content producers supply non-network programming, including talk shows, game shows and off-network reruns, to fill hours that stations do not source from their affiliated network. Finally, the emerging datacasting and next-generation broadcast segment, built around the ATSC 3.0 standard, is a nascent but strategically important slice of the industry, since it lets station owners use their spectrum for data delivery services beyond traditional video, a potential new revenue category still in early commercial deployment.
These segments interact through a layered set of contracts rather than a single linear supply chain. A local affiliate station simultaneously sells advertising directly to local businesses, collects retransmission fees from every pay television distributor operating in its market, pays reverse compensation to its network for the right to air network programming and licenses syndicated content to fill non-network hours. Radio groups follow a simpler structure without the retransmission layer, which is precisely why radio economics diverged from television economics over the past fifteen years even though both rest on the same regulatory foundation of licensed spectrum.
Market structure
Porter's Five Forces framework maps cleanly onto broadcast media because the industry's defining features, spectrum scarcity, regulatory licensing, concentrated buyer power on the distribution side and a credible but incomplete substitute in streaming, correspond directly to the five competitive pressures the framework isolates. Supplier power sits with the networks and sports leagues that control the programming stations need to fill their schedules. Buyer power sits with a small number of large pay television distributors and an advertiser base increasingly able to shift budget elsewhere. Rivalry plays out largely at the local market level between duopoly-owning station groups. New entrants face structural barriers rooted in spectrum finiteness even as ownership deregulation lowers the barrier to consolidation among existing players. And substitutes, principally streaming video and audio, have already captured a plurality of viewing time even though they have not replicated the industry's advertising economics or live-event exclusivity.
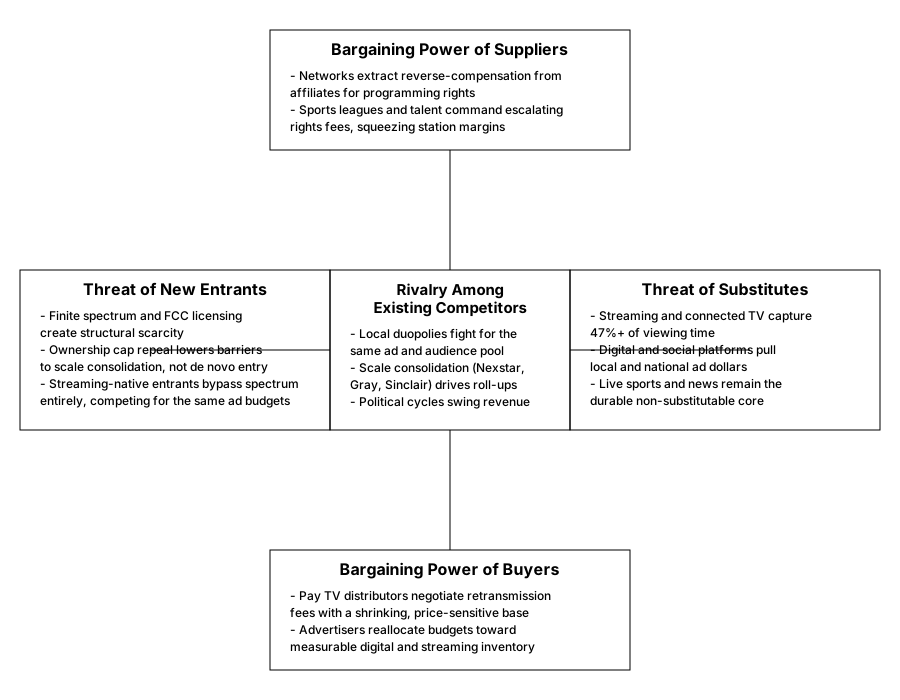
Bargaining power of buyers
Buyers in broadcast media split into two groups with very different negotiating dynamics. Pay television distributors, cable operators, satellite providers and vMVPDs, negotiate retransmission consent agreements directly with station owners and their leverage has grown as their own subscriber bases shrink and their appetite for absorbing further rate increases weakens. A distributor facing a shrinking subscriber count has less room to pass rate increases through to remaining customers without accelerating churn, which puts real ceiling pressure on how much stations can extract even as they try to raise per-subscriber rates to offset volume losses. Advertisers, the second buyer group, hold growing leverage of a different kind: the proliferation of digital and streaming inventory gives them credible alternatives to linear broadcast spots and programmatic buying tools let them compare broadcast reach against digital reach on a cost basis that broadcast has historically been reluctant to accept. Political advertisers are a partial exception, since federal law requires stations to offer candidates favorable, non-preemptible rates during campaign windows, which limits how much leverage a station can exercise over that particular buyer segment. Local small-business advertisers, by contrast, remain relatively fragmented and less able to extract concessions, giving stations more pricing power in that corner of the advertiser base than with major consumer brands or agencies buying at national scale.
| Buyer segment | Source of leverage | Constraint on broadcaster |
|---|---|---|
| Pay TV distributors | Control final retail bundle and subscriber relationship | Must avoid rate increases that accelerate subscriber losses |
| National advertisers and agencies | Access to digital and streaming alternatives with granular measurement | Can reallocate budget with limited switching cost |
| Political campaigns | Statutory lowest-unit-rate protections during election windows | Limited by federal equal-time and rate rules |
| Local small-business advertisers | Fragmented, limited alternative local reach | Lower leverage, stations retain pricing power |
Bargaining power of suppliers
The most consequential supplier relationship in television broadcasting is the one between local affiliate stations and the national networks that license them programming. Reverse compensation, the fee affiliates pay networks for the right to air network content, has grown steadily and now consumes a large share of the retransmission revenue a station collects, in some cases nearly all of it once other costs are accounted for, according to industry advocacy groups tracking the issue2. That arrangement gives networks substantial supplier power over affiliates despite the fact that affiliates, not networks, hold the actual FCC licenses and negotiate directly with distributors. Sports leagues represent the other major supplier power center, since live sports rights have become the most reliable driver of appointment viewing left in linear television and leagues have used that leverage to push rights fees higher with each renewal cycle, a cost that flows through to both network licensing fees and, indirectly, to affiliate reverse compensation. Talent, unionized production staff and news personalities represent a smaller but real supplier cost, particularly in competitive markets where anchor and reporter salaries can escalate during contract renewals. Equipment vendors supplying transmission, studio and newsroom technology hold comparatively little power, since this is a mature, multi-vendor category without meaningful lock-in beyond typical technology refresh cycles.
| Supplier category | Leverage mechanism | Effect on station economics |
|---|---|---|
| National networks | Control programming affiliates need to fill schedule | Extract reverse compensation from retransmission revenue |
| Sports leagues | Own exclusive live rights with no substitute | Escalating rights fees pressure network and affiliate costs |
| On-air talent and production unions | Skilled labor with market-specific value | Wage growth in competitive markets |
| Technology and equipment vendors | Fragmented, multi-vendor market | Limited pricing power over stations |
Rivalry among existing competitors
Rivalry in television broadcasting plays out mainly at the local market level, where two or three station groups typically compete for the same finite pool of local advertising dollars and the same retransmission negotiating table with distributors. Because most markets support only a handful of major network affiliates, direct head-to-head rivalry is more contained than in most consumer industries, but it has intensified indirectly through consolidation, as large station groups such as Nexstar and Gray Media acquire stations across dozens of markets and then compete with each other at the corporate level for retransmission rate benchmarks, political advertising share and acquisition targets. The pending Nexstar acquisition of Tegna, a $6.2 billion deal that would extend Nexstar's reach to roughly 80% of United States television households before regulatory and legal review intervened, illustrates how rivalry has shifted from local skirmishes to a national contest over scale itself3. Radio rivalry follows a similar local logic but with a national leader, iHeartMedia, that alone commands roughly 40% of measured radio advertising spend, giving it a scale advantage over regional operators that smaller groups cannot easily counter. Rivalry intensity rises further during election years, when a fixed pool of political advertising dollars gets contested aggressively across every station group with inventory to sell and falls back in odd years when that demand disappears and competitors are left fighting over a smaller base of commercial advertising.
| Rivalry dimension | Current dynamic | Strategic implication |
|---|---|---|
| Local market competition | Two to three affiliates compete per market | Contained but persistent price and share pressure |
| National scale consolidation | Large groups acquiring stations across markets | Rivalry shifts to corporate-level scale race |
| Political advertising cycles | Demand spikes in even years, falls in odd years | Two-year competitive intensity cycle |
| Radio market concentration | iHeartMedia holds outsized national share | Smaller operators face structural scale disadvantage |
Threat of new entrants
Spectrum finiteness remains the single strongest barrier to new entry in broadcast television and radio. Usable frequencies for full-power television and radio stations in most markets were allocated decades ago and the FCC rarely issues new full-power licenses in established markets, meaning any prospective entrant must acquire an existing license rather than build a new one from scratch. That structural scarcity is precisely why the FCC's 2026 decision to eliminate the national ownership cap, which had barred a single company from owning stations reaching more than 39% of United States television households, matters so much strategically: it does not open the door to new entrants at all, it simply lets existing owners consolidate further, reinforcing incumbency rather than diluting it4. A company wanting to enter broadcast media today at meaningful scale has essentially one route: acquire stations from an existing owner or acquire an entire station group, both of which require substantial capital and antitrust clearance that has grown more contested as consolidation deals draw scrutiny from state attorneys general and rival distributors. The more credible new-entrant threat comes from outside the traditional spectrum-licensed structure altogether, in the form of streaming-native companies and digital platforms that compete for the same advertising budgets without needing an FCC license at all, though this is better understood as substitution than direct entry, since these players are not broadcasting over licensed spectrum or collecting retransmission fees.
| Entry barrier | Description | Trend direction |
|---|---|---|
| Spectrum and license scarcity | Fixed number of usable frequencies per market | Structurally unchanged |
| Capital requirement for acquisition | Multi-billion-dollar station group purchases | Rising with consolidation deal sizes |
| Antitrust and regulatory clearance | State and federal review of ownership concentration | Increasingly contested |
| Ownership cap regulation | National reach limit on single owner | Eliminated in 2026, favors incumbents |
Threat of substitutes
Streaming video and audio represent the most consequential substitute broadcast media has faced in its history and the shift in viewing behavior is no longer marginal. Nielsen's audience measurement service found streaming accounted for 47.5% of total television usage, compared with 21.4% for broadcast and 20.2% for cable, meaning streaming alone now exceeds broadcast and cable combined in aggregate viewing time. Pew Research Center survey work published in mid-2025 found 83% of United States adults use a streaming service, while only about 35% still subscribe to cable or satellite television, with the gap widest among adults under 30, only 16% of whom maintain a pay television subscription5. That said, streaming has not fully substituted for broadcast in every use case. Live sports, breaking news and emergency information remain areas where broadcast retains a structural advantage, since streaming's technical latency and fragmented rights landscape make it a poor substitute for time-sensitive, must-see-now content, which is exactly why sports rights fees keep climbing even as overall linear viewing declines. Radio faces a milder but still real substitute threat from streaming audio and podcasting, offset somewhat by radio's persistent dominance of in-car listening, where streaming has made inroads but has not achieved outright replacement.
| Substitute category | Degree of overlap with broadcast | Broadcast's remaining advantage |
|---|---|---|
| Subscription streaming video | High for scripted and general entertainment | Live sports and breaking news less substitutable |
| Free ad-supported streaming | Growing overlap for advertiser budgets | Local news and community relevance |
| Streaming audio and podcasts | Moderate for music and talk listening | In-car dominance and free access |
| Social and short-form video | Partial overlap for younger audience attention | Appointment viewing for live events |
Value chain and profit pools
The broadcast media value chain runs through six identifiable stages. Content origination sits upstream, encompassing the national networks and syndicators that produce or license prime-time programming and the sports leagues that license live event rights, all of which set the raw programming cost the rest of the chain absorbs. Local content production is the second stage, where individual stations invest in newsroom staff, cameras, editing infrastructure and community reporting to create the local news and public affairs programming that differentiates one affiliate from another in the same market. Signal transmission and technical infrastructure form the third stage, covering towers, transmitters and, increasingly, the digital encoding infrastructure needed to support ATSC 3.0 datacasting and simulcast streaming, a stage that is capital intensive but not a major source of differentiation between competitors. Distribution and carriage negotiation is the fourth stage and arguably the most consequential commercially, encompassing the retransmission consent agreements stations negotiate with cable, satellite and vMVPD operators, agreements that determine a large and growing share of station cash flow. Advertising sales is the fifth stage, spanning local direct sales teams, national representative firms and, increasingly, programmatic and addressable advertising technology layered on top of traditional spot sales. Audience aggregation and measurement forms the sixth and final stage, where ratings services and audience data providers quantify the reach that gets sold to both advertisers and, indirectly, informs the retransmission rates distributors are willing to pay.
Profit concentrates unevenly across these six stages and understanding where is more useful strategically than describing the chain in full. Distribution and carriage negotiation captures the largest and fastest-growing share of profit, because retransmission fees are contractually locked in for multiyear periods, are largely insulated from the same cyclicality that hits advertising and scale with a station group's negotiating leverage rather than with the cost of producing content. Content origination captures the second-largest share, concentrated overwhelmingly among the handful of national networks and major sports leagues that control marquee programming, though this profit pool sits upstream of station owners rather than within their control. Local content production, by contrast, is a cost center more than a profit center for most stations, valuable strategically because it drives local ratings and differentiates a station from rivals, but rarely profitable in its own right once newsroom staffing costs are accounted for.
Profit pool
The clearest structural shift in broadcast media's profit pool over the past fifteen years has been the move from advertising to distribution as the primary source of margin. S&P Global Market Intelligence data shows gross retransmission and virtual subscription revenue reaching roughly $15.4 billion in 2025, projected to climb to $17.5 billion by 2030, even as core linear television advertising fell 7% to $55.2 billion in 2025 and faces further declines through 20276. This is a profit pool moving in exactly the opposite direction from where audience attention is moving, which is the central paradox of the industry today:
distribution revenue depends on a shrinking pay television subscriber base, yet per-subscriber rate increases have so far more than offset that shrinkage, keeping the pool growing in dollar terms
The economics are challenging for local stations, where affiliate fees consume all of, or even in excess of, a station's total retransmission consent revenue in smaller markets
Station groups with local market density, meaning ownership of multiple stations or duopoly positions within the same market, capture disproportionate value from this pool because density gives them negotiating leverage with distributors that a single-station independent lacks. National networks capture a separate, parallel slice of the same pool through reverse compensation, meaning the value created by retransmission consent gets split between local station owners and the networks that supply their programming, with networks typically capturing more than half. Radio's profit pool remains almost entirely advertising-driven, since radio has no retransmission consent mechanism, which is why iHeartMedia's growth strategy has leaned so heavily on digital audio and podcasting, businesses with fundamentally different unit economics than spot advertising, to diversify beyond a profit pool that is not expanding the way television's distribution pool is.
Industry economics and business models
Two dominant business models coexist within broadcast media and most large operators run both simultaneously rather than choosing one. The dual-revenue station model, dominant in television, monetizes the same content twice: once through advertising sales to businesses wanting audience attention and once through retransmission fees charged to distributors for the right to carry the signal at all. This model is structurally attractive because the second revenue stream, distribution fees, is contractually predictable and largely insulated from the same demand cycles that hit advertising, giving station groups a natural hedge within their own revenue mix. The pure advertising-supported model, dominant in radio and in the smaller independent television stations that lack retransmission leverage, monetizes audience attention only, making these operators considerably more exposed to advertising cyclicality and to the secular migration of ad budgets toward digital and streaming inventory.
A third, smaller but strategically significant pattern is emerging around data and infrastructure monetization, built on the ATSC 3.0 standard, which lets broadcasters use their licensed spectrum to deliver data services, targeted advertising insertion and enhanced content beyond a single video stream. This model remains commercially nascent relative to the first two, but it represents the industry's most direct answer to the question of what broadcasters do with a scarce, valuable asset, spectrum, once traditional linear viewing continues to erode. Networks and major sports rights holders operate a fourth, licensing-centric model, generating revenue primarily by selling programming and rights access to station groups and streaming platforms rather than by owning distribution infrastructure directly, a capital-light approach that concentrates profit upstream while pushing capital intensity and regulatory complexity downstream onto station owners.
Cost drivers and scalability
Broadcast station economics carry a cost structure weighted heavily toward fixed costs, which is precisely what makes scale so valuable in this industry. Newsroom staffing, transmission infrastructure, studio facilities and network affiliation fees are largely fixed regardless of how much advertising a station sells in a given quarter, meaning incremental advertising revenue drops through to profit at a high rate once those fixed costs are covered. This dynamic rewards consolidation directly: a station group that owns multiple stations across markets can spread corporate overhead, sales technology, back-office functions and even some newsroom resources across a larger revenue base, lowering average cost per station in a way an independent single-market owner cannot replicate. It also explains why retransmission negotiating leverage scales so strongly with market density, since a distributor negotiating with a company that owns stations across dozens of markets faces a fundamentally different bargaining dynamic than one negotiating with a single independent station, unable credibly to threaten a blackout that would only affect one market rather than dozens simultaneously.
Political advertising introduces a distinct scalability dynamic of its own, since the marginal cost of selling an additional political advertising spot is close to zero once a station's sales infrastructure exists, meaning political revenue flows through to profit at an unusually high margin in even-numbered election years. This is why station group earnings guidance is typically presented on a two-year cycle basis rather than a simple year-over-year comparison, since a straight annual comparison would make odd years look artificially weak and even years artificially strong. Variable costs matter most in the radio segment and in digital extensions of both radio and television, where incremental content and distribution costs for podcasting and digital audio scale more gradually with audience growth than legacy broadcast infrastructure costs do, giving radio groups a genuine, if still modest, growth lever that does not depend on spectrum scarcity or retransmission negotiation at all.
Moats, advantages and strategic levers
The primary defensibility mechanism in broadcast media is regulatory: FCC licensing creates a legal monopoly over specific spectrum allocations within a given geographic market and that scarcity cannot be replicated by a competitor no matter how much capital it deploys, short of acquiring an existing license. Network affiliation functions as a second, closely related moat, since the four major networks distribute their most valuable programming, including marquee sports packages and prime-time entertainment, exclusively through their affiliate networks, meaning an unaffiliated station competing in the same market operates at a structural programming disadvantage regardless of its local news quality. Scale itself has become a third and increasingly dominant moat, since station groups with density across many markets gain disproportionate leverage in retransmission negotiations, in advertising rate cards sold to national agencies and in the ability to absorb reverse compensation increases that would strain a smaller independent operator's balance sheet.
Local content and community relevance represent a softer but real differentiation-based moat, particularly for stations that have built decades of trust as the primary source of local news, weather and emergency information in their market, a form of switching cost embedded in audience habit rather than contract. Live sports and news exclusivity function as a moat against the streaming substitute specifically, since these content categories resist the on-demand, time-shifted consumption pattern that has hollowed out linear television's advantage in scripted entertainment. Data and audience measurement capability is emerging as a fourth strategic lever rather than a fully established moat yet, as station groups that invest early in addressable advertising technology and ATSC 3.0 datacasting position themselves to capture new revenue streams before competitors catch up, though this advantage remains far less entrenched than the regulatory and scale moats that have defined the industry for decades.
Strategic levers
Consolidation through acquisition is the most immediately available lever following the FCC's 2026 repeal of the national ownership cap and it is the lever every major station group is currently pulling or evaluating, since scale directly increases retransmission leverage, spreads fixed costs and strengthens negotiating position with both networks and distributors simultaneously. Vertical integration into content ownership is a second lever, visible in Nexstar's ownership of The CW broadcast network and the NewsNation national news network alongside its local station portfolio, a strategy that captures value further upstream in the chain rather than remaining purely a distribution and local sales operation. Digital and addressable advertising expansion is a third lever, aimed squarely at defending advertising revenue against the migration to streaming and digital inventory by giving station groups measurable, targetable inventory that can compete more directly with digital platforms on the terms advertisers increasingly demand.
Geographic and demographic portfolio balancing is a fourth lever, particularly relevant for groups managing exposure to political advertising cycles, since a station portfolio concentrated in swing states and competitive media markets captures disproportionate political spending in election years but faces a sharper comedown in odd years, making portfolio composition a genuine risk-management decision rather than a purely opportunistic one. A fifth lever, still early but strategically important, is the direct build-out of ATSC 3.0 datacasting capability, positioning station groups to monetize spectrum for data delivery services that have nothing to do with traditional video advertising, a hedge against the possibility that linear video advertising continues its structural decline regardless of how well any individual operator executes.
Structural risks, regulation and trends
The most significant structural risk facing broadcast media is the continued erosion of the pay television subscriber base that funds retransmission revenue, the industry's fastest-growing profit pool. Leichtman Research tracking shows United States pay television subscribers falling from a peak near 100 million in 2012 to an estimated 55 to 60 million by 2026, with the pace of decline accelerating rather than stabilizing in the most recent two years, as the last cohort of sports-motivated subscribers begins shifting toward streaming-based live television alternatives. If that trend continues, station groups eventually reach a point where per-subscriber rate increases can no longer offset subscriber losses in dollar terms, a scenario some analysts already flag as approaching for smaller, less diversified station groups even though larger consolidators still show growing distribution revenue in aggregate.
Regulatory risk cuts in two directions simultaneously. The FCC's 2026 decision to eliminate the national ownership cap favors incumbents pursuing consolidation, but the same period has brought increased antitrust scrutiny from state attorneys general, evident in the litigation that froze the Nexstar-Tegna transaction after a federal judge granted DIRECTV's request for a preliminary injunction on antitrust grounds7. That tension between a deregulating FCC and an antitrust environment still willing to block consolidation on competitive grounds means the regulatory trajectory for large-scale mergers remains genuinely uncertain even as the ownership cap itself has been lifted. Technology disruption risk is well understood but still underweighted in some legacy station group planning, given how quickly streaming has captured viewing time share; broadcasters that treat ATSC 3.0 and digital simulcast as optional experiments rather than core infrastructure investments risk ceding the technology transition entirely to streaming-native competitors.
Secular demand trends point toward continued audience fragmentation, with younger demographics showing dramatically lower pay television and even broadcast television adoption than older cohorts, a generational pattern unlikely to reverse as those cohorts age, since media consumption habits formed early tend to persist. Supply-side trends favor continued consolidation, both because deregulation makes it legally easier and because scale economics make it financially necessary for smaller station groups to remain competitive in retransmission negotiations against larger rivals. A credible strategic playbook for a new entrant into broadcast media, realistically defined as an acquirer of existing stations rather than a spectrum applicant, should favor a focused acquisition strategy targeting station groups with strong local market density and duopoly positions rather than broad geographic dispersion, since density is what generates retransmission leverage and should build regulatory relationships early given how much the sector's trajectory depends on FCC and antitrust decisions. Incumbent station groups, by contrast, face a defend-and-consolidate playbook: protect existing retransmission relationships through multiyear contract renewal discipline, pursue further consolidation while the ownership cap remains lifted and invest deliberately in ATSC 3.0 and digital advertising infrastructure as a hedge against the linear advertising decline that shows no sign of reversing.
Nexstar Media Group
Nexstar Media Group offers the clearest illustration of how consolidation strategy has reshaped broadcast television economics over the past three decades. Perry Sook founded the company in 1996 with a simple thesis: acquire underperforming local television stations, improve their news operations and sales execution and treat retransmission consent as a repeatable, growing revenue stream rather than a one-time negotiating exercise. That thesis has compounded into the largest local television station ownership group in the United States, operating or servicing more than 200 stations across 116 markets and reaching approximately 70% of American television households as of 2025, a scale achieved almost entirely through acquisition rather than organic station-by-station buildout.
Business model and revenue mix
Nexstar's 2025 revenue of roughly $4.9 billion split 59% distribution and 40% advertising, with the remaining share coming from political advertising, a mix that demonstrates precisely the industrywide shift this analysis describes at company scale. The company layers a genuinely cyclical advertising business, local, national and political, on top of a relatively steady distribution revenue base, giving it more earnings stability than a single-revenue-stream competitor would have during advertising downturns. Beyond its local station portfolio, Nexstar owns The CW broadcast network and NewsNation, a national news network, both acquired to capture value further upstream in the content chain rather than remaining purely a local station and advertising sales operation, a deliberate vertical integration move that few of its station-group peers have matched at similar scale.
Consolidation strategy and regulatory exposure
Nexstar's pending acquisition of Tegna for $6.2 billion, announced in August 2025, would extend the combined company's reach to approximately 80% of United States television households and add more than 60 stations to its portfolio, a scale only achievable because the FCC's 2026 repeal of the 39% national ownership cap removed the regulatory ceiling that would have made the deal legally impossible under the old rule. The transaction closed in March 2026 after the FCC's Media Bureau granted a cap waiver and required only six station divestitures, a relatively light remedy given the scale of the combination. That approval, however, did not end the story:
a federal judge converted a temporary restraining order sought by DIRECTV into a full preliminary injunction the following month, finding DIRECTV had shown a likelihood of success on its antitrust claim and ordered Nexstar to halt integration with Tegna pending further litigation
What the Nexstar case demonstrates
The Nexstar trajectory demonstrates three dynamics central to broadcast media strategy today. First, scale genuinely compounds in this industry in a way that is unusual even by media standards, because retransmission negotiating leverage, political advertising capture and fixed-cost absorption all improve directly with market density and station count, rewarding consolidation more than almost any other lever available to a station operator. Second, regulatory trajectory can reprice an entire consolidation strategy almost overnight, since the same ownership cap repeal that made the Tegna deal legally possible also invited the antitrust challenge that has since frozen its integration, showing how deregulation on one front does not eliminate scrutiny on another. Third, vertical integration into owned content assets, evident in Nexstar's CW and NewsNation ownership, signals that even the most acquisition-focused station consolidators recognize that distribution scale alone is not a complete strategy and that capturing some value further upstream in programming reduces long-term dependence on networks that extract reverse compensation from every dollar of retransmission revenue collected.
Broadcast media remains the mechanism through which live news, sports and local information reach mass audiences over licensed spectrum and cable carriage and it still throws off real cash despite secular audience erosion. Distribution fees have replaced advertising as the primary profit engine, station groups with local market density and network affiliations command the leverage and consolidation under a loosened ownership cap is the dominant strategic response available to incumbents. The industry's durability rests on live event exclusivity, spectrum scarcity and regulatory relationships that streaming challengers cannot easily replicate, but the subscriber base funding retransmission fees keeps shrinking and every station group's medium-term plan now depends on how well it can extract value from a smaller, pricier pay TV footprint while its advertising base migrates elsewhere.
Citation
Cite this article
Sridharan, M. A. (2023, September 6). Industry Analysis: Broadcast Media. Think Insights. https://thinkinsights.net/strategy/industry-analysis-broadcast-media (Accessed [[ACCESS_DATE]])
Sridharan, Mithun A. "Industry Analysis: Broadcast Media." Think Insights, 6 Sep. 2023, https://thinkinsights.net/strategy/industry-analysis-broadcast-media. Accessed [[ACCESS_DATE]].
Mithun A. Sridharan, "Industry Analysis: Broadcast Media," Think Insights, September 6, 2023, https://thinkinsights.net/strategy/industry-analysis-broadcast-media. Accessed [[ACCESS_DATE]].
Sridharan, M.A. (2023) 'Industry Analysis: Broadcast Media', Think Insights. Available at: https://thinkinsights.net/strategy/industry-analysis-broadcast-media (Accessed: [[ACCESS_DATE]]).
M. A. Sridharan, "Industry Analysis: Broadcast Media," Think Insights, 2023. [Online]. Available: https://thinkinsights.net/strategy/industry-analysis-broadcast-media. [Accessed: [[ACCESS_DATE]]].
Sridharan MA. Industry Analysis: Broadcast Media. Think Insights. Published September 6, 2023. Accessed [[ACCESS_DATE]]. https://thinkinsights.net/strategy/industry-analysis-broadcast-media
Test Your Knowledge
Industry Analysis: Broadcast Media
Challenge yourself on the concepts from this article and see how well you understood them.
Subscribers get weekly quizzes and insights — subscribe free
Sponsor this article
Partner with Think Insights
Reach 50,000+ business leaders, consultants, and strategists. Feature your brand alongside expert articles on strategy, leadership, and digital transformation.
Become a Sponsor