Industry Analysis: Gaming/E-Sports


Gaming and e-sports create interactive entertainment, monetize player engagement and organize competitive ecosystems around software, platforms, communities and media. Demand is shaped by customer need, regulation, technology and macro conditions, but attractive margins usually concentrate where a provider controls a scarce capability, owns a trusted customer relationship, or operates a system that becomes cheaper or more valuable at scale. Bargaining power is shifting toward sophisticated buyers that can standardize procurement and toward suppliers that control scarce talent, data, infrastructure, licenses, or distribution. Management should therefore prioritize a defensible segment, repeatable delivery, measurable unit economics and a clear reason customers cannot easily substitute the provider.
Is gaming/e-sports attractive for new entrants?
Entry can be attractive when a focused customer problem is underserved and the entrant can avoid the heaviest fixed costs. The case weakens where regulation, installed relationships, capital intensity, or scale economics dominate procurement.
Which parts of the value chain are most profitable?
Profit tends to concentrate where differentiation, scarcity, recurring demand, or control of distribution limits price comparison. Commodity inputs and easily benchmarked execution usually face more pressure.
How is technology changing this industry?
Technology changes delivery cost, information flow, customer acquisition and measurement. The strategic effect depends on whether automation reinforces differentiation or turns the core output into a commodity.
What capabilities are table stakes versus differentiators?
Table stakes include reliable delivery, financial controls, compliance and domain competence. Differentiators include workflow integration, proprietary data, specialized expertise, trusted distribution and measurable customer outcomes.
How should investors and consultants evaluate opportunities here?
Test customer concentration, pricing power, utilization, recurring revenue, capital intensity, working capital, regulatory exposure and the share of economics tied to scarce capabilities. Then examine whether growth produces operating leverage.
Where is bargaining power shifting?
Power moves toward the party controlling a scarce input, a critical workflow, a trusted channel, or a meaningful switching cost. Technology can move that position quickly.
What is the biggest economic trap?
Revenue growth can conceal structurally flat margins when each new unit of revenue requires nearly proportional labor, inventory, support, or capital. Management should separate volume growth from true operating leverage.
What creates the strongest moat?
The strongest moat usually combines customer trust with embedded workflow, specialized knowledge, data, or physical infrastructure. The combination is harder to replicate than any single feature.
How should incumbents respond to automation?
Automate repeatable work while protecting the judgment, relationships and assets customers pay to trust. Revisit pricing when automation changes the link between input cost and customer value.
What is the best entry strategy?
Choose one segment where the entrant can build references and repeatable delivery quickly. Partner where regulation, infrastructure, or distribution would otherwise slow market access.
Industry at a glance
Gaming/E-Sports is best understood as a system of economic activities rather than a single product category. Gaming and e-sports create interactive entertainment, monetize player engagement and organize competitive ecosystems around software, platforms, communities and media. The commercial question is where scarce inputs, differentiated capabilities, regulation, distribution, or customer trust create an advantage that survives normal competitive pressure. This analysis treats the industry as a value chain and tests how buyers, suppliers, rivals, entrants and substitutes influence the distribution of economic returns.
The scope includes the commercial activities that directly deliver the core outcomes of gaming/e-sports and excludes adjacent sectors whose economics are governed by materially different demand or regulatory structures. The customer base can span business-to-business (B2B), business-to-consumer (B2C) and business-to-government (B2G) demand, depending on the segment. Revenue models commonly include project fees, recurring contracts, subscriptions, transactions, usage-based charges, licensing, asset returns, or blended arrangements. Capital intensity varies from predominantly labor and software to asset-heavy operations, while regulation can range from light-touch commercial rules to licensing, safety, environmental, financial, or public-sector controls.1
Industry segmentation
The industry can be segmented into five economically distinct positions. Premium games typically sit close to the core input or service layer and compete on access, cost, reliability, or specialized supply.
Free-to-play and live services usually convert those inputs into a customer-facing service or product and therefore carry more operational complexity. Mobile gaming often capture value through distribution, specialization, or recurring customer relationships.
Game platforms and distribution can create higher switching costs because they integrate into customer workflows or regulated processes. Esports and competitive ecosystems often sit at the edge of the market where niche expertise, data, or brand can support differentiated economics.
The segments should be dimensioned by customer type, value-chain position, asset intensity and technology because nominally similar providers can have very different margins and risk profiles.
Market structure
Porter's Five Forces analysis is useful here because the industry's returns depend less on headline demand than on how value is divided among customers, suppliers, competitors, entrants and substitutes. Buyer concentration can compress price when procurement is standardized.
Supplier scarcity can raise costs when talent, technology, materials, infrastructure, or licenses are difficult to replace. Rivalry becomes more intense when offerings are comparable and capacity is easy to add.
Entry barriers rise when regulation, capital, data, installed workflows, or network effects matter. Substitution becomes credible when customers can solve the same problem through an adjacent technology, internal capability, or different operating model.
The central strategic task is therefore to identify which force can change the profit pool fastest and which capabilities can counter it.
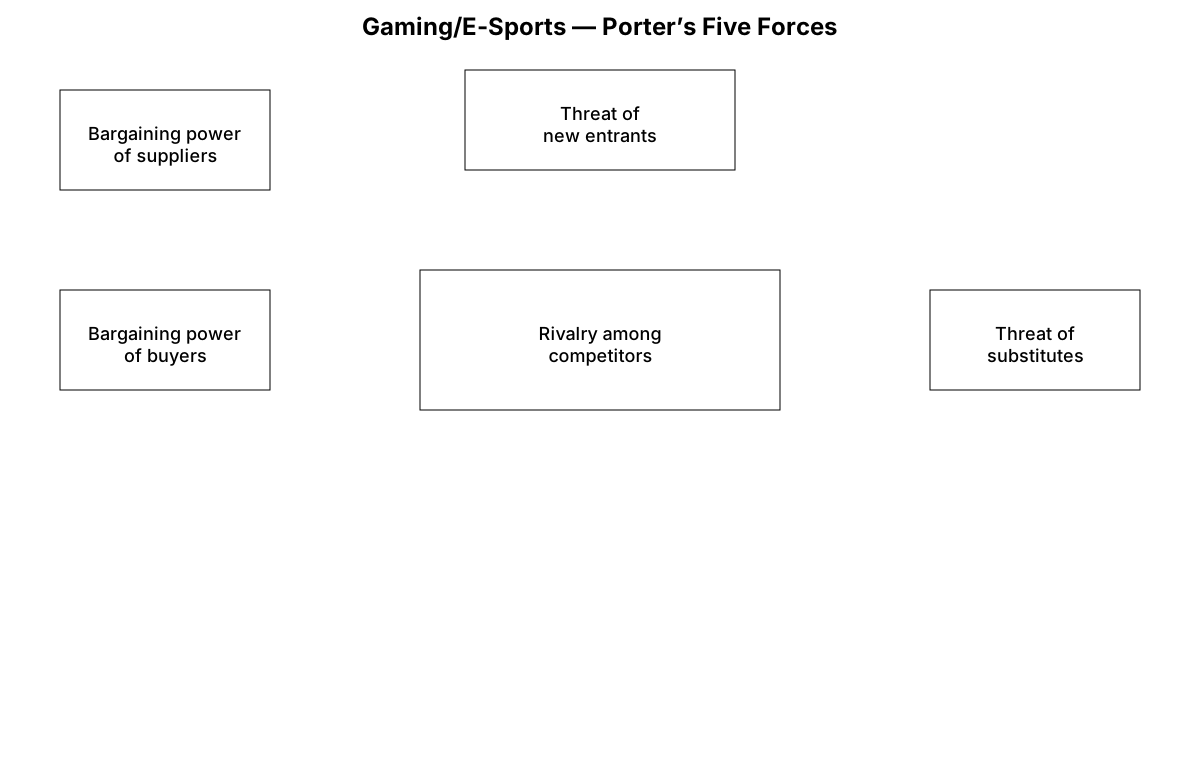
Bargaining power of buyers
Buyers gain leverage when they are concentrated, procurement is standardized, switching costs are low and outputs can be compared on price. In gaming/e-sports, this force is often strongest in segments where specifications are transparent and multiple qualified providers can meet the same requirement.
Buyers can also shift power by bundling demand, moving work in-house, or using digital procurement systems. Providers retain leverage when the service is critical, regulated, difficult to evaluate, or embedded in a workflow.
The practical implication is that management should measure not only customer concentration but also the cost and operational risk of switching. A customer representing a large share of revenue is not necessarily powerful if replacement is difficult; a smaller buyer can be powerful when it can re-source immediately.
| Dimension | Executive implication | What to test |
|---|---|---|
| Customer concentration | Concentrated buyers can pressure price and terms | Revenue share, contract concentration, rebid frequency |
| Switching friction | Embedded workflows reduce buyer mobility | Migration effort, data portability, retraining |
| Price transparency | Comparable offers intensify procurement pressure | Bid dispersion, benchmark availability, tender frequency |
| Criticality | Mission-critical services preserve supplier leverage | Cost of failure, downtime, compliance exposure |
Bargaining power of suppliers
Supplier power depends on scarcity, substitution difficulty and the supplier's ability to move downstream. The critical suppliers in gaming/e-sports may include labor, technology platforms, raw materials, infrastructure, licenses, intellectual property, data, or distribution access.
Scarcity becomes economically meaningful when customers also require certifications, reliability, or continuity that prevents rapid substitution. Supplier power can be reduced through dual sourcing, standardization, vertical integration, better forecasting, or redesign of the service.
It can also increase when a provider becomes dependent on a platform whose terms are outside its control. Management should therefore distinguish between ordinary procurement spend and inputs that can constrain capacity or customer delivery.
| Dimension | Executive implication | What to test |
|---|---|---|
| Input scarcity | Scarce inputs can constrain growth and raise cost | Vacancy rates, lead times, qualified alternatives |
| Platform dependence | Critical platforms can capture economics | Fee changes, access rules, concentration |
| Specialist talent | Credentialed talent can limit capacity | Hiring time, retention, utilization |
| Vertical integration | Control of key inputs can defend supply | Make-versus-buy economics, asset utilization |
Rivalry among existing competitors
Rivalry is the central competitive pressure because it determines how much of the industry's demand becomes profit rather than price competition. Rivalry rises when providers offer comparable outputs, customers can switch easily, capacity is abundant and fixed costs encourage utilization chasing.
It can soften when firms specialize, own differentiated distribution, build switching costs, or operate in regulated niches. The key distinction is between nominal market fragmentation and economic fragmentation:
many legal entities do not necessarily imply low concentration if a small group controls the most valuable customers, assets, or channels
Management should track win rates, discounting, customer churn, capacity utilization and competitor entry into profitable segments.
| Dimension | Executive implication | What to test |
|---|---|---|
| Fragmentation | Fragmented markets can sustain local niches but invite price competition | Share concentration, local density, pricing dispersion |
| Differentiation | Distinct capabilities reduce direct comparability | Outcome measures, IP, specialization |
| Fixed costs | High fixed costs can intensify utilization battles | Capacity utilization, break-even volume |
| Consolidation | Scale can improve procurement and distribution | M&A activity, network density |
Threat of new entrants
Entry is easiest when customers can understand and compare the offer, required capital is modest, regulation is light and distribution is accessible. It becomes harder when entrants need licenses, trusted references, installed infrastructure, proprietary data, network density, or significant working capital.
Technology can lower entry barriers by reducing delivery costs while simultaneously raising them when scale data or platform effects become important. The strategic question is whether the entrant can acquire customers before incumbents can copy the initial proposition.
Strong incumbents therefore defend not only through brand but through workflow integration, reference accounts, cost curves and control of scarce assets.
| Dimension | Executive implication | What to test |
|---|---|---|
| Capital requirements | Asset intensity can deter entry | Initial investment, working capital, payback |
| Regulation | Licensing and compliance slow market access | Approval time, certification cost |
| Distribution | Customer access can be harder than production | CAC, channel concentration |
| Scale effects | Scale can lower unit cost or improve service | Unit cost versus volume, network density |
Threat of substitutes
Substitutes solve the same customer problem through a different operating model. For gaming/e-sports, substitutes can include internal execution, adjacent services, alternative technologies, platform models, automation, or simply postponing the purchase.
The threat becomes stronger when customers perceive the output as a commodity and weaker when the service is critical, regulated, or deeply integrated. Management should monitor substitute economics rather than merely tracking direct competitors.
A new technology can initially look like a niche alternative and become a major substitute once reliability, distribution and total cost of ownership improve.
| Dimension | Executive implication | What to test |
|---|---|---|
| Internalization | Customers can bring selected work in-house | Internal build cost, talent availability |
| Adjacent technology | Different tools can solve the same need | Performance, adoption, total cost |
| Workflow redesign | Customers can eliminate the need entirely | Process changes, automation rate |
| Deferral | Customers can postpone discretionary demand | Budget sensitivity, purchase frequency |
Value chain and profit pools
The value chain in gaming/e-sports can be viewed as a sequence of upstream inputs, production or service delivery, distribution, customer interface and enabling infrastructure. Upstream inputs determine the cost and availability of the scarce resources required to deliver the offer.
Production or service delivery converts those inputs into the outcome customers purchase. Distribution determines access, reach and transaction economics.
The customer interface shapes acquisition, retention, pricing and cross-selling. Enabling infrastructure includes regulation, standards, platforms, data systems, financing and compliance mechanisms that allow the market to function.
Profit does not accrue evenly across these stages. It tends to migrate toward the stage that controls scarcity, differentiation, recurring demand, or a structural cost advantage.
Profit pool
In gaming/e-sports, profit pools typically favor providers that combine differentiated capability with repeatable delivery. Commodity-like inputs face pressure unless the supplier owns scale, scarce capacity, or an advantaged location.
Service execution can generate attractive returns when utilization is high and the provider has specialized know-how, but labor-heavy delivery can limit operating leverage. Distribution and customer interface can capture disproportionate value when they control demand or access to customers.
Enabling infrastructure can become the strongest profit pool when regulation, data, network effects, or switching costs create structural barriers. Management should map profit by customer, product, workflow and asset rather than relying on company-level averages.
Industry economics and business models
Four business-model patterns recur across gaming/e-sports. First, asset-heavy operators earn returns from utilization, throughput, route density, or capacity management.
Second, asset-light service providers monetize specialized labor and customer relationships through projects, retainers, or recurring contracts. Third, platform models capture transaction or subscription revenue while using data and network effects to improve matching, distribution, or retention.
Fourth, hybrid models combine physical assets with software, data, financing, or recurring service layers. The right model depends on the customer problem and the source of scarcity.
A recurring contract does not automatically create good economics if delivery costs rise in lockstep with revenue, while a transactional model can be attractive when fixed costs are low and repeat demand is high.
Cost drivers & scalability
Cost structure determines whether growth creates leverage or simply expands workload. Fixed costs can include facilities, equipment, software platforms, licenses, technology development and central functions.
Variable costs can include labor hours, materials, transaction fees, logistics, commissions, energy and customer support. Economies of scale appear when fixed costs are spread over more volume or when procurement, distribution, data and process automation improve with size.
Economies of scope appear when the same customer relationship, technology, or infrastructure can support adjacent products. Unit economics should be tracked at the level where decisions are made:
utilization and contribution margin for services, throughput for manufacturing, customer acquisition cost and lifetime value for digital models and return on invested capital for asset-heavy operators
A useful growth loop is to use higher volume to improve data or procurement, convert those gains into better service or lower cost, acquire more customers and reinvest the resulting cash into the capability that strengthens the loop.
Moats, advantages and strategic levers
Defensibility in gaming/e-sports comes from a combination of cost, differentiation, switching costs, regulation, data and network effects. Cost advantage is strongest when scale, asset utilization, procurement, or process design create a repeatable gap that competitors cannot quickly close.
Differentiation comes from outcomes, reliability, brand, specialization, experience, or product performance that customers value enough to pay for. Network effects matter when each additional participant improves the value of the system for others.
Switching costs arise when data, workflow, training, integration, or customer history make replacement disruptive. Regulatory moats exist where licensing or compliance capability is scarce and durable.
Data and learning create a moat when more transactions improve prediction, automation, benchmarking, or personalization. The most durable positions combine at least two of these mechanisms.
Strategic levers
- Focus on the customer segment where the company has a measurable right to win
- Narrow the product scope until delivery becomes repeatable before expanding adjacencies
- Integrate vertically only where control of a bottleneck changes customer economics
- Use technology to reduce repeatable work while protecting differentiated judgment and trust
- Build ecosystem relationships that lower acquisition cost or raise switching costs
Structural risks, regulation and trends
Structural risk in gaming/e-sports comes from regulation, technology, input costs, labor availability, geopolitical exposure and changes in customer behavior. Regulatory risk can alter permissible business models, reporting requirements, licensing, or operating costs.
Technology disruption can lower the cost of delivery while making existing capabilities less differentiated. Commodity and energy exposure can compress margins in asset-heavy segments.
Geopolitical and supply-chain risks matter where critical inputs or markets are concentrated. Macro trends should be assessed through scenarios rather than point forecasts:
a base case, a downside case where procurement or demand weakens and an upside case where technology expands the addressable market
The most important secular pattern is often platformization, automation, or servitization, which can shift value from one stage of the chain to another.2
Demand and customer economics
Demand in gaming/e-sports should be decomposed into structural demand, cyclical demand and discretionary demand. Structural demand comes from needs that persist even when budgets tighten, including compliance, replacement, safety, basic operating capacity, or unavoidable transactions. Cyclical demand follows construction, capital expenditure, employment, consumer confidence, interest rates, or other macro variables, while discretionary demand is the portion customers can delay or eliminate. Management should therefore avoid using a single market-growth assumption for the whole portfolio. Customer-level analysis should distinguish volume growth from price growth, new-account acquisition from expansion within existing accounts and contractual revenue from demand that depends on repeated re-purchase. The most attractive customer segments often combine high retention with low service variability because the provider can spread acquisition and onboarding costs across a longer relationship. Buyers with urgent or regulated needs may also tolerate higher prices, but only when service reliability is credible. A useful diagnostic is to rank customers by gross margin, retention, payment behavior, concentration, service complexity and switching friction, then compare that ranking with the sales organization's account priorities. If the two rankings diverge, the commercial model may be rewarding volume rather than economic quality.3
The same analysis should be applied to customer cohorts rather than only to the aggregate customer base. A mature account can appear attractive because it has high revenue while consuming substantial service capacity, whereas a smaller account may have better contribution margins and greater expansion potential. Contract terms also matter because renewal timing, indexation, minimum volumes, service-level obligations and termination rights determine how much nominal recurring revenue is actually economically recurring. Management should calculate contribution margin after the costs required to retain and serve the account, not merely after direct production cost. This creates a more useful view of the commercial portfolio and exposes accounts where sales growth has created operational drag.
Operating model
The operating model determines whether the business can convert demand into cash without allowing complexity to absorb the gains from scale. In gaming/e-sports, the critical choices include centralization versus local delivery, standardization versus customization, owned assets versus outsourced capacity and specialist teams versus generalist labor. Each choice changes the balance between utilization, responsiveness, control and fixed cost. Standardization can improve throughput and quality, but excessive standardization can weaken differentiation where customers pay for tailored outcomes. Local delivery can improve customer intimacy while increasing management overhead and reducing purchasing leverage. Outsourcing can reduce capital requirements but may create supplier dependency or weaken control of the customer experience. Executives should map the operating model from order intake to final delivery and identify where work waits, where information is re-entered, where quality checks repeat and where scarce specialists spend time on routine tasks. The highest-value improvement is often a redesigned workflow that removes avoidable handoffs. Management should also distinguish capacity constraints from demand constraints. Adding capacity to a business with weak pricing or poor customer acquisition can destroy returns, while improving utilization in a constrained business can unlock operating leverage.4
Operating resilience should be treated as an economic variable rather than a compliance exercise. A supplier that is cheaper but unreliable can impose hidden costs through downtime, emergency procurement, customer credits and management attention. A highly centralized model can create efficiency while increasing the impact of a single failure. A highly decentralized model can improve resilience while duplicating overhead. The right answer depends on the cost of interruption and the reversibility of the underlying decision. Management should therefore model not only average unit cost but also variance, recovery time and failure impact. That approach is particularly important when customers buy continuity rather than a discrete product.
Technology and data
Technology changes gaming/e-sports through four channels: lower transaction cost, better decision quality, faster delivery and new forms of customer access. The strategic effect depends on whether the technology becomes a proprietary capability or a broadly available commodity. Generic software can improve productivity but rarely creates a moat by itself. Proprietary data, workflow integration, automation tuned to a specific process, or a feedback loop that improves performance with usage can create more durable advantage. The management challenge is to attach technology investment to a measurable economic constraint such as utilization, error rates, acquisition cost, cycle time, compliance effort, or customer retention. Data quality is equally important. If data is fragmented across systems or captured inconsistently, advanced analytics can increase apparent sophistication without improving decisions. A strong technology roadmap therefore begins with the operating model and works backward to the data and systems required to improve it. The best digital investments often make the core business more predictable before they make it more automated.5
Artificial Intelligence can accelerate this shift, but its economic value depends on workflow placement. Automating a low-value administrative step may improve employee experience without materially changing unit economics, while automating a constrained expert workflow can change capacity and pricing. The relevant question is therefore not how much Artificial Intelligence the company uses, but which bottleneck it removes and who captures the resulting surplus. Management should also test whether automation changes customer expectations. When routine output becomes faster or cheaper, buyers may demand more service at the same price, causing productivity gains to flow back to customers unless the commercial model is redesigned.
Capital allocation and portfolio choices
Capital allocation should follow the location of the industry's structural advantage rather than the visibility of the largest growth opportunity. In gaming/e-sports, management can allocate capital to capacity, technology, acquisitions, geographic expansion, customer acquisition, working capital, or capability development. Each choice has a different time-to-payback and different exposure to execution risk. Acquisitions can accelerate entry into a customer segment or add scarce capabilities, but they can also import low-quality revenue, operational complexity, or cultural friction. Organic expansion is slower but can reveal whether the operating model actually scales before the company commits more capital. Portfolio decisions should therefore use hurdle rates that reflect customer concentration, regulatory risk, asset specificity and the durability of demand. Management should measure return on incremental capital rather than average return on the existing asset base. A mature business can have excellent historical returns while new investment produces mediocre economics. Conversely, a temporarily low-return business can be attractive if new capacity unlocks a genuine bottleneck and demand is visible. The strategic question is whether the next unit of capital strengthens the company's moat or simply buys more volume.6
Portfolio pruning is part of capital allocation. Products, customers, geographies and operating units can remain in a portfolio because they have strategic history even when they no longer meet economic thresholds. A disciplined portfolio review should ask whether each activity improves the core position, creates a credible option, or consumes scarce management capacity without sufficient return. Exit decisions can be politically difficult, but delayed exits often raise the cost of eventual restructuring. The strongest operators create explicit rules for reinvestment, maintenance capital, acquisitions and divestment so that the portfolio evolves through repeated economic decisions rather than episodic enthusiasm.
Scenario analysis and leading indicators
Executives should stress-test gaming/e-sports against changes that alter the distribution of bargaining power rather than only changes in market size. A downside scenario could combine weaker demand with higher input costs and more aggressive procurement, forcing the business to reveal which customers and products remain economically attractive. An upside scenario could combine stronger demand with automation that expands capacity without proportional labor growth. A disruption scenario should test a substitute technology, a regulatory change, the loss of a major supplier, or a platform rule change that shifts economics quickly. The purpose is not to predict which scenario will occur. It is to identify which variables deserve active monitoring and which decisions remain sound across multiple futures. Leading indicators should include renewal rates, quote-to-win conversion, utilization, backlog quality, input lead times, customer concentration, regulatory milestones, service defects and cash conversion. Each indicator should have an explicit management action attached to it. Otherwise the dashboard becomes reporting rather than strategy. Scenario planning becomes most valuable when it changes investment sequencing, hiring, sourcing, pricing, or partnership decisions before financial statements reveal the problem.7
The most useful scenario plans also identify no-regret moves. These are actions that improve resilience or economics across several plausible futures, such as reducing unnecessary process variation, diversifying a critical supplier, improving data quality, increasing contract visibility, or shifting capacity toward customers with better contribution margins. Management should separate these moves from contingent bets that only make sense under one forecast. This distinction reduces strategic overreaction and makes the organization more willing to act before uncertainty disappears.
Management dashboard
A management dashboard for gaming/e-sports should connect operating indicators to economic outcomes. The first layer should show demand quality: new bookings, renewal or repeat rate, average revenue per customer, customer concentration and the share of demand that is contractual or otherwise recurring. The second layer should show delivery economics: utilization, throughput, cycle time, service defects, labor productivity and variable cost per unit of output. The third layer should show cash and capital: working-capital days, maintenance capital, incremental capital expenditure, free cash conversion and return on incremental invested capital. The fourth layer should show strategic position: pricing realization, win rate, churn, switching friction, supplier concentration, regulatory milestones and the share of revenue generated by differentiated offerings. These measures should be reviewed together because a change in one often creates a misleading signal in another. For example, higher utilization can improve margins while also increasing service defects if capacity is being pushed beyond a sustainable level. Similarly, higher revenue per customer can conceal a deteriorating mix if the additional revenue requires disproportionate service effort.
The dashboard should also distinguish leading indicators from lagging indicators. Revenue, operating profit and cash flow are necessary but retrospective. Renewal intent, quote conversion, backlog quality, hiring lead time, supplier lead time, customer complaints, product adoption and regulatory approvals can provide earlier warning. Each leading indicator should have a threshold and an associated decision. If customer concentration rises above a defined level, management may change acquisition priorities or contract terms. If supplier lead times cross a threshold, procurement may qualify an alternate source. If utilization falls below the economic break-even point, capacity additions should pause and commercial actions should accelerate. If service quality deteriorates, growth targets may need to be subordinated to operational stabilization. This makes the dashboard an operating system for strategy rather than a monthly reporting artifact.
The most useful dashboard is also segmented. Company-wide averages can hide important differences between customer groups, geographies, products, channels, or asset classes. Management should therefore identify the dimensions that explain most of the variance in margin and retention and review them separately. In gaming/e-sports, this can reveal that one segment has high revenue but weak contribution, while another has lower volume and much stronger economics. It can also reveal where bargaining power is moving. A customer segment with rising concentration and falling switching costs may require a different commercial strategy from a segment where demand is fragmented and service differentiation remains strong.
A final requirement is governance. Every metric should have a clear owner, a defined calculation and a documented action when performance moves outside the desired range. Data should be consistent enough that business units cannot redefine metrics to explain away deterioration. Senior leaders should focus on a small number of measures that expose structural changes, while operating teams can maintain more detailed diagnostic metrics beneath them. This approach improves decision speed and makes strategic trade-offs visible before they become financial outcomes. It also creates a record of which assumptions management has tested, which actions it has taken and which parts of the operating model remain uncertain.
A useful final test is whether the dashboard can support an investment committee decision without requiring a separate narrative reconstruction. Management should be able to explain which economic variable changed, why it changed, whether the change is temporary or structural and what action will alter the trajectory. This discipline is especially useful when a market is expanding because growth can mask deterioration in price, mix, working capital, or service quality. The same framework should be applied to strategic initiatives. Every major initiative should have a baseline, an expected economic mechanism, a leading indicator, a financial outcome and a decision date. Initiatives that do not change one of these variables should be reconsidered. Over time, this creates an organizational learning loop in which strategic hypotheses are tested against operating evidence rather than defended through narrative. It also helps boards distinguish between management teams that are simply reporting performance and teams that understand the mechanisms producing it. In a fragmented or rapidly changing industry, that difference can determine whether scale produces a stronger competitive position or merely a larger cost base.
The board should also ask whether management has identified the smallest set of assumptions that could invalidate the plan. That question forces attention onto the variables that actually drive returns and prevents strategic reviews from becoming long lists of activities. It is a practical way to keep capital, people and technology aligned with the industry's economic structure.
That review should occur before annual planning, not after budgets are committed. It gives leadership a common basis for deciding which capabilities deserve additional investment, which activities should be standardized and which assumptions require contingency plans. It also creates a clearer link between strategy, operating cadence and resource allocation across the organization.
This approach keeps the analysis anchored in observable economics. It gives decision-makers a repeatable way to compare growth, margin, risk and defensibility without relying on market narratives alone.
Strategic playbook: how to win in this industry
A new entrant should begin with a narrow customer problem where incumbents are either expensive, slow, difficult to integrate, or poorly differentiated. Build a referenceable delivery model before broadening the offer.
Partner for licenses, infrastructure, distribution, or scarce capabilities that would otherwise consume capital without creating differentiation. An incumbent should defend the core through customer intimacy, workflow integration and cost discipline, then expand only when shared capabilities improve customer economics.
Geographic expansion should follow a repeatable operating model rather than precede it. Platform strategies should be pursued only when participation creates measurable network value.
The strategic objective is to create a system in which scale improves cost, data, service quality, or customer retention rather than merely increasing revenue and complexity.8
Caselet: Electronic Arts
Electronic Arts illustrates the shift from packaged game sales toward digital distribution, live services, recurring engagement and player communities. The economics increasingly depend on lifetime engagement, content cadence, platform fees and intellectual property.
Industry at a glance
The company operates within the core value chain of gaming/e-sports and demonstrates how industry structure becomes visible in operating decisions.
Its history shows the importance of scale, customer access, specialist capability, or regulated infrastructure.
The case is useful because it connects the abstract forces above to an actual business model rather than treating the industry as a static category.
Market structure
The company's competitive position depends on the same five forces that shape the wider market. Buyer power is moderated when the company controls differentiated capacity or trusted distribution. Supplier power matters when specialist labor, physical inputs, platforms, or licenses constrain expansion.
Rivalry is managed through scale, specialization, brand, technology, or portfolio breadth. Entry barriers arise from capital, regulation, installed relationships, or accumulated know-how. Substitutes remain credible when customers can internalize work or adopt an alternative technology.
The case shows why a strong position is usually a system of reinforcing capabilities rather than a single product advantage.
Value chain and profit pools
The company captures value at several points in the chain, but the most durable economics tend to sit where it can control a scarce resource or customer relationship. Operating scale can lower unit cost, while data, workflow integration, or brand can increase willingness to pay.
The strategic lesson is that the profit pool is rarely identical to the revenue pool. Management teams should ask which activities create pricing power and which simply carry volume through the system.
Strategic playbook
The case suggests three practical priorities. First, protect the capability that customers find difficult to replace.
Second, standardize repeatable processes so scale improves economics rather than adding coordination cost. Third, use technology and partnerships selectively to strengthen the core position.
Expansion is attractive when it reuses existing assets, data, relationships, or distribution. It becomes risky when it adds unrelated complexity without improving the company's structural position.9
Economics and risks
The company also illustrates the industry's trade-off between growth and capital or operating intensity. A strong revenue trajectory can still produce weak returns if expansion requires proportional headcount, inventory, capacity, or customer acquisition spending.
Conversely, a mature operator can create attractive cash generation when utilization, procurement, recurring contracts and pricing discipline reinforce one another. The key risks are those that can break that operating system: regulatory changes, technology substitution, input scarcity, concentration, or loss of customer trust.10
- 1Esa Regulatory And Industry Resources
- 2Ftc Evidence And Standards
- 3Customer And Market Guidance
- 4Operating Evidence
- 5Technology Or Policy Guidance
- 6Institutional Evidence
- 7Research And Institutional Guidance
- 8Esrb Market Or Regulatory Guidance
- 9European Commission Sector Evidence
- 10Bis Research And Institutional Guidance
Gaming/E-Sports converts specialized inputs into outcomes that customers value, but its economics vary sharply by position in the value chain. Profit pools tend to favor differentiated capabilities, recurring relationships, controlled distribution and assets or data that create scale advantages. The strategic levers are segment focus, workflow integration, operating leverage, technology-enabled productivity and disciplined expansion. New entrants should start with a narrow wedge and partner around regulatory or infrastructure barriers. Incumbents should protect customer access while using data, automation and process standardization to widen the gap between revenue growth and cost growth.
Citation
Cite this article
Sridharan, M. A. (2023, March 7). Industry Analysis: Gaming/E-Sports. Think Insights. https://thinkinsights.net/digital-transformation/industry-analysis-gaminge-sports (Accessed [[ACCESS_DATE]])
Sridharan, Mithun A. "Industry Analysis: Gaming/E-Sports." Think Insights, 7 Mar. 2023, https://thinkinsights.net/digital-transformation/industry-analysis-gaminge-sports. Accessed [[ACCESS_DATE]].
Mithun A. Sridharan, "Industry Analysis: Gaming/E-Sports," Think Insights, March 7, 2023, https://thinkinsights.net/digital-transformation/industry-analysis-gaminge-sports. Accessed [[ACCESS_DATE]].
Sridharan, M.A. (2023) 'Industry Analysis: Gaming/E-Sports', Think Insights. Available at: https://thinkinsights.net/digital-transformation/industry-analysis-gaminge-sports (Accessed: [[ACCESS_DATE]]).
M. A. Sridharan, "Industry Analysis: Gaming/E-Sports," Think Insights, 2023. [Online]. Available: https://thinkinsights.net/digital-transformation/industry-analysis-gaminge-sports. [Accessed: [[ACCESS_DATE]]].
Sridharan MA. Industry Analysis: Gaming/E-Sports. Think Insights. Published March 7, 2023. Accessed [[ACCESS_DATE]]. https://thinkinsights.net/digital-transformation/industry-analysis-gaminge-sports
Test Your Knowledge
Industry Analysis: Gaming/E-Sports
Challenge yourself on the concepts from this article and see how well you understood them.
Subscribers get weekly quizzes and insights — subscribe free
Sponsor this article
Partner with Think Insights
Reach 50,000+ business leaders, consultants, and strategists. Feature your brand alongside expert articles on strategy, leadership, and digital transformation.
Become a Sponsor